Why Bitcoin Might Dip Before a Year‑End Rally — Liquidity, Options, and Mt. Gox Risks
Summary
Executive snapshot
The short version: a mix of macro liquidity tightening, a visible rotation in derivatives positioning, and clear on‑chain evidence of retail capitulation argues for a near‑term slide in BTC. That downside could be transient if concentrated long‑term holders and institutions step in — creating the conditions for a year‑end rebound toward targets discussed in the market, including a $104,000 scenario. This article unpacks the mechanics driving the move, cites recent market evidence, and offers practical trade and portfolio management ideas for intermediate traders and asset managers.
The liquidity thesis: why dollar funding matters now
Arthur Hayes frames the current Bitcoin weakness around dollar liquidity tightening — essentially the idea that when USD liquidity is being withdrawn or when credit conditions tighten, risk assets suffer first. His note argues that reduced dollar liquidity forces deleveraging across the system, which pushes volatile assets like BTC lower as participants cut exposure to meet margin calls or to raise cash (Arthur Hayes' liquidity note).
This is a useful lens because it connects macro flows to crypto microstructure. When liquidity is ample, leveraged traders and OTC desks can warehouse risk; when liquidity tightens, those same desks shrink inventories and widen spreads. For Bitcoin, that translates to larger sell pressure during liquidity shocks and thinner bids at the margin.
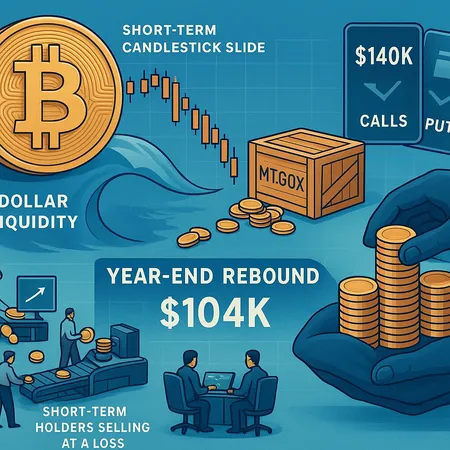
Options market: from $140K calls to bearish puts
A vivid market‑structure signal is the options complex. Recent reporting shows a dramatic reversal in options positioning — where the market once priced a very skewed upside bias (big $140K call exposure), it now reflects heavier put demand and a tilt toward downside protection (options‑market evidence).
Why does this matter? Options traders and market‑makers adapt quickly. When puts become expensive and call interest falls, implied volatility and skew adjust, informing hedging flows that can amplify directional moves. In practice:
- Dealers selling protection hedge by selling futures or buying spot, pressuring prices.
- Large institutional buyers of puts create near‑term demand for downside liquidity.
- A flip in skew often precedes short squeezes or continued weakness depending on liquidity depth.
For a trader, the options market is both a warning light and a tactical toolkit: if puts are dominating, consider protective structures or harvested premium strategies rather than naked long exposure.
On‑chain evidence: short‑term holders are capitulating
On‑chain metrics complement derivatives: short‑term holders (STHs) depositing BTC to exchanges at a loss is a classic capitulation marker. Recent analysis shows meaningful flows of STH supply to exchanges, often correlated with local price lows and forced selling (on‑chain STH deposits study).
Two implications flow from that:
- Retail or short‑duration participants are more likely to sell into weakness, increasing available sell liquidity.
- If STHs are hitting the exits, price discovery becomes concentrated among longer‑dated holders and OTC counterparties — which can create deeper, more violent moves on lower order‑book depth.
This pattern sits well alongside Hayes’ liquidity argument: tightening funding + retail capitulation = transient overshoot lower.
Large outflows and concentrated supply: Mt. Gox adds near‑term pressure
Compounding the near‑term supply picture are large wallet movements — most notably the Mt. Gox batch transfers and exchange dumps reported recently. These movements can flood the market with fee‑sensitive liquidity and have historically coincided with periods of downward pressure (Mt. Gox movements and dumps).
Large, concentrated selling is more market‑impactful than dispersed, small trades. When big holders decide to liquidate (or are forced to distribute), they test and often remove resting bids, creating larger intraday ranges and gapping price action.
How concentrated whale accumulation vs retail capitulation sets up a recovery
Importantly, not all on‑chain flows are the same. The current narrative may be distilling retail capitulation while long‑dated holders and whales quietly accumulate. That concentration can compress supply at lower prices and create a potent recovery once liquidity stabilizes.
Two dynamics to watch:
- Concentrated accumulation: If wallets associated with institutional custody or known whale addresses show rising balances during weakness, that indicates strategic buying rather than panic accumulation. This reduces free float and supports sharper bounces.
- Retail clean‑out: As panic sellers exit, the remaining holders are higher conviction. Markets sometimes recover quickly once liquidity sellers are exhausted and buyers re‑enter.
A recent price‑target narrative argues that an oversold unwind could propel BTC back toward $104,000 by year‑end as liquidity normalizes and demand re‑asserts ($104K target scenario). Combine that with Hayes’ year‑end rebound expectation and you have a plausible two‑stage path: a near‑term drawdown followed by a squeeze/recovery.
Putting the pieces together: a plausible market path
- Dollar liquidity tightens → forced deleveraging → retail and leveraged longs sell.
- Options positioning flips to puts → dealers hedge into the market → adds selling pressure.
- Large supply events (Mt. Gox/exchange dumps) increase near‑term available BTC.
- Short‑term holders capitulate onto exchanges, compressing depth.
- Whales and institutional buyers accumulate concentrated positions off the sell‑off.
- As liquidity improves and sellers exhaust, concentrated bids and short covering drive a rapid rebound, potentially toward $104K.
This scenario is not guaranteed, but it is internally consistent with the data sets discussed.
Trade and risk management implications for traders and asset managers
Tactical posture should differ by time horizon and mandate. Here are actionable, intermediate‑level considerations:
Position sizing: reduce outright exposure and favor scaled entries. If you manage a fund, consider lockbox sizes and predefine tranche buys (e.g., 25/25/50 percent allocations across defined price bands).
Hedging: buy puts or put spreads for downside protection rather than relying on stop orders. For capital efficiency, consider a collar (long spot + sold call financed by a bought put) to cap upside but protect downside.
Volatility capture: if you have basis access, sell short‑dated volatility after the sell‑off if implied vol spikes too high — but size carefully; vol mean reverts unpredictably in stressed markets.
Cash management: maintain USD/stablecoin dry powder to scale into any washouts. Bitlet.app clients often use staged buys when market structure looks chaotic.
Watch funding and liquidation metrics: perpetual funding rates, exchange balances, and concentrated large transfers (e.g., Mt. Gox) can signal accelerating flows. If funding flips heavily negative and exchange balances rise, risk is skewed toward more near‑term downside.
Institutional operations: revisit custody instructions and flow windows. If a large outflow is imminent, stagger execution to minimize market impact; use OTC desks for block trades.
Strategy examples:
- Conservative: buy several cash‑secured puts at different strikes to hedge principal while leaving upside participation.
- Opportunistic: sell put spreads to collect premium when you have dry powder to buy into strikes you would happily hold long term.
- Tactical arb: pair long spot with short futures during anticipated short squeeze windows to capture basis compression.
Key on‑chain and derivatives signals to monitor
Prioritize a small watchlist of high‑signal metrics:
- Exchange net flows and short‑term holder exchange deposits (retail capitulation gauge).
- Options skew and put/call ratio (positioning reversal indicator) — monitor the kind of shift reported in the options coverage.
- Large‑wallet transfers and known Mt. Gox distributions (supply shock monitor).
- Perpetual funding rates and open interest (liquidity and leverage stress).
These signals, combined with macro liquidity headlines, will help time entries and sizing.
Practical example: a risk‑managed playbook
Imagine BTC is at $60,000 and you expect a short‑term slide to $48–52K before a year‑end recovery. A sample playbook:
- Allocate 40% of intended long exposure now at $60K using small tranche buys.
- Buy a 3‑month put at $50K covering 40% notional (insurance) — this caps drawdown risk on the initial tranche.
- Keep 40% dry powder to buy into $52–48K and scale the remaining 20% if $45K prints.
- If put skew normalizes and $104K narrative regains momentum, unwind hedges early and let core long hold for the rebound.
Adjust strikes, maturities, and sizing to your risk tolerance and liquidity constraints.
Final takeaways
Bitcoin appears poised for a two‑stage move: a near‑term slide driven by dollar liquidity contraction, options‑market repositioning, and on‑chain retail selling (plus Mt. Gox supply events), followed by a potential year‑end recovery if concentrated buyers and institutions step in and liquidity normalizes. The $104K scenario is plausible if buying is concentrated and sellers have been washed out, but that path is conditional and timing is uncertain.
Act with defined risk parameters: expect volatility, use options for protection or yield, monitor exchange balances and derivatives positioning closely, and keep dry powder to opportunistically accumulate. For asset managers, staggered execution and careful custody/OTC coordination can materially reduce market impact during these amplified moves.
For deeper reading on the signals referenced here see Arthur Hayes’ liquidity note, the recent options positioning report, on‑chain short‑term holder data, Mt. Gox transfer coverage, and the price‑target analysis cited above. And remember: short‑term noise can be loud, but structure and liquidity ultimately determine price pathways — a lesson both traders and institutions should build into position sizing and execution plans.


