Bitcoin price prediction: Is BTC coiling under $108K for a breakout attempt?
Summary
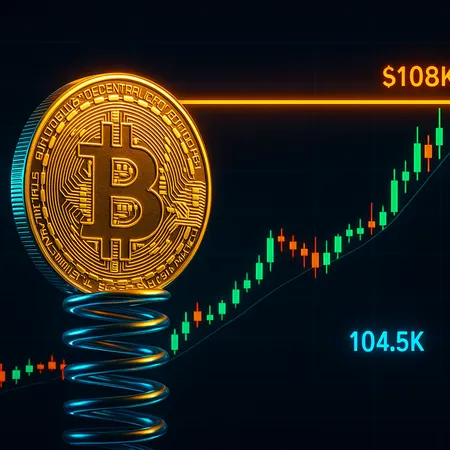
Market snapshot: compression under $108K
Bitcoin is currently hovering near $104.5K, trading in a tightening range just below the $108K resistance. The pattern looks like a classic coiling phase: price makes smaller candles, volatility contracts, and momentum indicators cool off. That kind of compression often precedes a sharp directional move — either a breakout above resistance or a breakdown to lower supports — depending on which side absorbs liquidity first.
Volume has been subdued compared with the run-up earlier in the year, and spot ETF flows have shown intermittent buying rather than a steady surge. On-chain metrics are mixed: exchange outflows continue in pockets, but realized price and net position change suggest many holders remain locked in. Altcoins and memecoins have been quieter relative to their typical correlation spikes, while NFTs and DeFi narratives continue to attract discrete capital rather than broad liquidity.
Technical setup and key levels
From a technical perspective, $108K stands out as the immediate resistance. A clean daily close above that level with expanding volume would increase the odds of a continuation toward the next structural targets. On the downside, $100K is the first meaningful support; a break there could open a slide to $98K and then the previous consolidation zone.
Momentum indicators such as the 14-day RSI are in neutral-to-mildly-bullish territory but lack strong divergence to signal runaway strength. Short-term moving averages have flattened, which often precedes a decisive move. Derivatives show modest long-open interest and a small skew in favor of calls, meaning options markets are pricing in some upside but not aggressively. Traders should watch for volatility expansion and whether spot ETF inflows pick up pace — those flows can rapidly tilt order books.
Trade scenarios and risk management
If BTC pushes above $108K with volume and sustained ETF inflows, the breakout scenario becomes plausible; traders may look for quick targets near the next psychological levels while trailing stops to lock gains. Conversely, if BTC fails at resistance and starts undercutting $100K, risk-off flows could accelerate, and leverage-driven liquidations may amplify downside.
Position sizing matters. Given the compressed structure, expect sharper moves than average once volatility returns. Use layered entries and clear stop-loss levels rather than all-in bets. For conservative participants, waiting for a confirmed daily close above $108K or price reclaiming $100K as support can reduce false-break risk.
Catalysts, macro context and outlook
Near-term catalysts include continued spot ETF flows, macro data (inflation, rate guidance), and liquidity events tied to major holders. Geopolitical news or a sudden shifts in risk appetite can flip the tape quickly. On-chain signals — exchange net flows, realized cap, SOPR — should be monitored for confirmation alongside order book dynamics.
For traders using platforms like Bitlet.app, this is a classic “wait and watch” setup where alerts around $108K and $100K are useful. Keep an eye on broader crypto market rotation: renewed strength in memecoins or DeFi projects can coincide with BTC breakouts, while weakness there can presage declines.
Conclusion: poised but not guaranteed
Bitcoin is coiling beneath $108K, and the next directional move will likely be sharp once volatility returns. The balanced view: a breakout above $108K could resume the bullish leg, while a failure would test $100K–$98K supports. Monitor ETF flows, volume expansion, and on-chain confirmations before committing capital, and manage risk with disciplined stops and position sizing.