Why Bitcoin’s Slide to $93k–$95k Is More Than a Blip: ETFs, Liquidations & Fed Risk
Summary
Executive summary — this is more than a routine pullback
Bitcoin’s slide into the low $90ks is not simply a normal retracement. Over the last week the market has seen three compounding forces converge: sustained spot ETF redemptions in the US, a wave of forced liquidations from leveraged players, and a shift in Fed-rate expectations that removes a tailwind for risk assets. Together these dynamics compress liquidity and make technical levels more consequential. For many traders and allocators, this means rethinking sizing and hedges ahead of the next macro decision points.
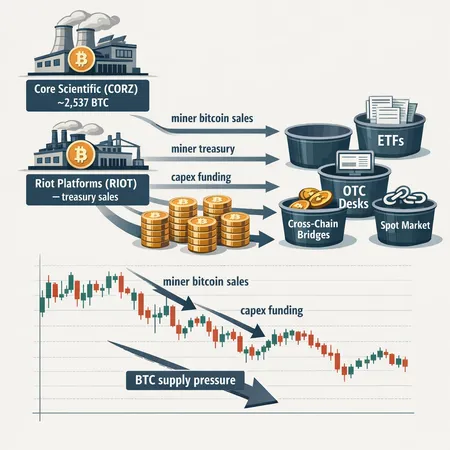
What happened: flows, liquidations and price action
The headlines capture the shape: US spot Bitcoin ETFs recorded sizable outflows — a third consecutive week of net redemptions totaling roughly $1.11 billion — which drained a key source of buy-side demand and put pressure on price discovery (report). At the same time Bitcoin slid below $94k and liquidations spiked; reporting placed the immediate liquidations linked to the drop at roughly $617 million across the broader crypto markets, with additional short-lived spikes reported as exchanges unwound leveraged long positions (breaking report).
Crypto-specific coverage also flagged a sharp move under $94k that triggered cascading stops and margin calls as automated risk engines reacted to intraday volatility (coverage). Meanwhile price was already consolidating around ~$95k heading into a heavy US macro and FOMC calendar, which left the market sensitive to any surprise in Fed forward guidance (analysis).
Why now: ETF redemptions + a heavy macro calendar
There are three interacting reasons the timing turned ugly:
Spot ETF outflows remove an institutional, non-leveraged bid from the market. ETFs like IBIT and other spot products operate through creation/redemption channels; sustained net redemptions convert paper demand into downward pressure on spot liquidity. That $1.11B figure is not trivial — it's concentrated and persistent.
Levered positioning had become stretched. When ETFs stop providing predictable inflows, marginal buyers—particularly highly leveraged traders—become vulnerable to price moves that trigger liquidations. Liquidations then feed more selling into an already thin market.
The macro calendar: the Fed and US data weeks create episodic volatility windows. As markets priced down the odds of near‑term rate cuts, the constructive macro narrative for risk assets softened. When the odds of easier policy fade, those who had allocated to BTC on a policy-verus-inflation playbook re-evaluate exposure fast.
Put together: ETFs bled, leverage cracked, and macro risk amplified the cascade.
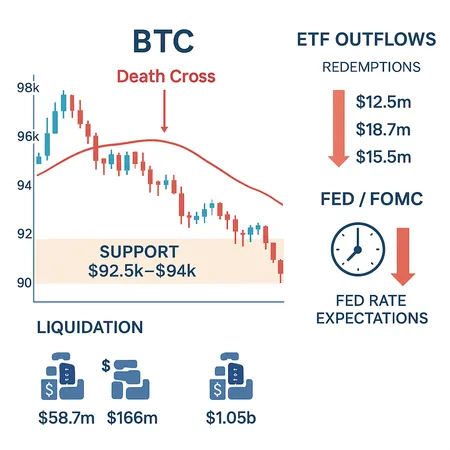
Technical danger zones: death cross, and support at $92.5k–$94k
From a technical standpoint, three things matter now:
Support band $92.5k–$94k. This zone has functioned as a short-term liquidity shelf. Failure to hold it would likely invite accelerated selling as short-term traders and stop orders cluster below.
Death cross risk. A classic death cross — the 50-day moving average crossing below the 200-day moving average — is a multi-timeframe bear signal that can change the psychology of allocators and systematic strategies that use moving-average signals. Even the threat of such a cross can alter positioning.
Order-book thinness near recent lows. With ETF outflows reducing institutional compulsion to buy, the order-book becomes shallower. That makes price moves more sensitive to single large orders or liquidations.
Technically, the stakes are binary: holding $92.5k–$94k keeps mean-reversion and range-trading scenarios alive; a clear break and retest lower would increase the probability of extended consolidation or a deeper retracement.
Quantifying the liquidation shock and market liquidity implications
Reported numbers tell the story: immediate liquidations associated with the move were in the mid‑hundreds of millions — with the widely cited figure of ~$617M in liquidations across crypto during the crash window. That number understates knock-on effects:
- Liquidations force exchanges to deleverage inventories, temporarily increasing selling pressure.
- Market makers widen spreads when adverse selection rises, making execution for large institutional buys more expensive.
- ETFs that rely on secondary market liquidity to create or redeem shares (e.g., IBIT flows) face higher slippage when converting ETF demand into spot purchases.
In short: a relatively concentrated outflow combined with leverage clean-up can turn what appears to be a modest price move into a dislocation because liquidity evaporates right when it's needed most.
Why this matters beyond BTC: contagion to broader crypto liquidity
Bitcoin still functions as the primary market bellwether. A forced deleveraging in BTC spills into altcoins and DeFi: margin calls can trigger exits from leveraged positions across derivatives and lending platforms, while market makers may pull back from riskier pairs. That dynamic reduces liquidity in on‑chain markets and centralized venues alike, elevating execution risk and increasing funding‑rate volatility for perpetuals.
For many traders and institutional desks the lesson is straightforward: BTC stress tests the whole stack. If BTC liquidity tightens, so do the options and futures markets that institutions use for hedging and express market views.
Probable short-to-medium term scenarios (and what to watch)
Here are three practical scenarios and the market signals that would validate each:
Scenario A — Range-bound recovery (base case, 40–50%): BTC finds support in the $92.5k–$95k band, ETF flows stabilize, and the FOMC messaging is dovish enough to restore risk-on sentiment. Watch: sustained net inflows into spot ETFs, narrowing spreads, and improving funding rates.
Scenario B — Deeper consolidation (30–40%): Support fails; the death cross occurs and the market re-tests $80k–$88k for liquidity. Watch: continued ETF redemptions, rising on-chain outflows to exchanges, and widening option skew.
Scenario C — Volatility shock & repricing (10–20%): Macro surprise (e.g., hawkish Fed or worse-than-expected US data) triggers another leg down with concentrated liquidations and broad risk-off. Watch: sharply higher realized volatility, exchange liquidation tallies, and renewed spikes in stablecoin inflows to exchanges.
These are not predictions but probability-weighted frameworks for planning.
Risk-management playbook — tactical steps for traders and allocators
Here are concrete, actionable measures for intermediate-to-advanced traders and institutional allocators:
Re-assess position sizing: cap any new directional exposure to a small percentage of NAV (e.g., 1–2% per trade for active traders; institutions may apply a volatility-adjusted risk budget). Smaller not only limits drawdown but preserves optionality.
Reduce leverage quickly: forced deleveraging is where most losses compound. Lower gross exposure in futures and margin desks; prefer outright spot or delta‑neutral hedges if you must maintain exposure.
Use options to hedge: buy protective puts or construct collars to limit tail risk. If cost-prohibitive, consider selling shorter-dated structures against a small core hedge.
Monitor ETF creation/redemption mechanics: flows in products such as IBIT can presage price pressure. If large redemptions become persistent, widen execution expectations and factor in higher slippage.
Maintain liquidity buffers: ensure cash or liquid stablecoin reserves to capitalize on dislocations and to meet margin calls without forced asset sales.
Stagger execution: for larger trades use sliced execution and TWAP/POV algorithms to avoid market impact when order books are thin.
Scenario-driven rebalancing: write explicit rebalancing triggers tied to macro events (FOMC statements, CPI releases) rather than reacting ad hoc to intraday noise.
For allocators using platforms and tooling, services like Bitlet.app can help model installment buys and simulate dollar-cost strategies with an eye toward volatility regimes — but always combine platform tools with pre-defined risk rules.
Checklist for the next macro windows
Before major US data or the next FOMC, run through this checklist:
- Are ETF flows stable or still net outflows? (If the latter, assume lower natural liquidity.)
- What are current funding rates and open interest on major venues? Rising funding can precede squeezes.
- How concentrated are our counterparties? Counterparty risk matters when exchanges widen spreads or halt liquidations.
- Do we have an options-based hedge, and at what cost? Recalculate as implied vols shift.
Closing thoughts
The recent move toward $93k–$95k is not an isolated price blip. It’s the product of overlapping structural pressures: ETF outflows removing a dependable bid, leverage-induced liquidations that amplify selling, and a macro regime where Fed signals can tip market psychology quickly. For traders and institutional allocators the path forward is pragmatic: reduce fragility, use hedges, size positions conservatively, and plan for multiple scenarios. Keep monitoring flows (including ETFs like IBIT), liquidation tallies, and the FOMC calendar — those inputs will likely determine whether this episode becomes a contained pullback or the start of a deeper repricing.
For active desks, that means operational readiness and a clear risk budget; for allocators it means re-evaluating allocation bands and liquidity buffers in a higher-volatility world. And for anyone executing in thin markets, execution tactics and counterparty choice are as important as market view.