Analyst Report Highlights Bitcoin's Bearish Phase Triggered by Death Cross
Summary
Market Snapshot
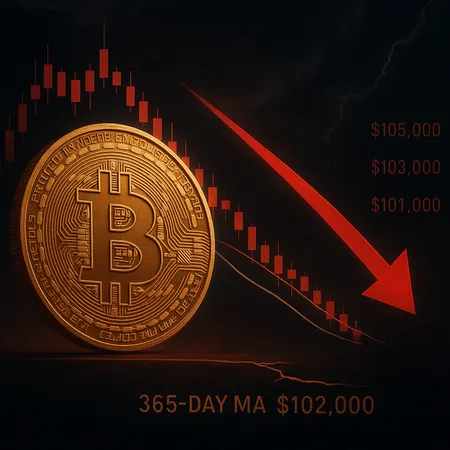
Bitcoin's price action has taken a decisive bearish turn after the emergence of its fourth death cross, a classic technical signal that occurs when a shorter-term moving average crosses below a longer-term moving average. The report highlights that BTC has also slipped below the 365-day moving average of $102,000, a level many market participants treated as structural support. This combination has amplified investor caution and nudged sentiment toward the negative side in the broader crypto market.
Technical Breakdown: What the Death Cross Means
A death cross is not an immediate sell-by signal, but it often reflects deteriorating momentum. In this case, the crossover signals that recent price weakness has outpaced longer-term gains. Traders who rely on moving averages interpret this as confirmation to tighten risk parameters or reduce exposure. Historically, death crosses can precede extended consolidation or deeper pullbacks, though outcomes vary by cycle and macro backdrop.
Why the 365-Day Moving Average Matters
The 365-day moving average functions as a sentimental and technical anchor for many long-term BTC holders. Falling beneath that $102,000 mark removes a reference point used by institutions, funds, and algorithmic strategies. Without that support, stop-loss clustering and algorithmic rebalancing can add to downside pressure. At the same time, breaking a key average can create opportunities for buyers who view the move as an entry point — but timing remains critical.
Implications for Traders and Investors
Short-term traders should prepare for increased volatility and tighter risk management, while longer-term investors will watch on-chain metrics and fundamental adoption signals. This environment tends to favor active position management: reducing leverage, trimming concentrated exposure, or staging buys through dollar-cost averaging. The death cross also affects related markets — expect contagion into altcoins, memecoins, and DeFi risk assets — pressuring liquidity across the crypto ecosystem and blockchain projects.
Signals to Watch Next
Key indicators to follow include the 50- and 200-day moving averages for potential support or additional crossovers, derivatives funding rates, and exchange flows. On-chain metrics like realized price, active addresses, and long-term holder behavior will help differentiate a transient pullback from a regime change. Keep an eye on macro catalysts such as rate announcements and dollar strength, which can exacerbate moves in BTC and DeFi sectors.
Conclusion
The analyst report paints a cautious near-term outlook: the fourth death cross and the breach of the 365-day MA at $102,000 increase the probability of a prolonged bearish phase, though outcomes will hinge on on-chain resilience and macro developments. Traders on platforms like Bitlet.app should reassess risk settings and watch the indicators above before making directional bets. For now, discipline and clear risk rules will be more valuable than conviction alone.