How Institutional Bitcoin ETF Adoption Is Reshaping Price Dynamics in Late 2025
Summary
Introduction: institutional capital meets Bitcoin's market
The late 2025 market feels different. Big allocators are no longer whispering about crypto from the sidelines — they're buying through regulated, spot-backed exchange-traded products. That structural shift matters because a Bitcoin ETF doesn't just provide easier access, it rewires the plumbing that moves dollars into and out of BTC. For many traders, Bitcoin is increasingly being priced not only by on-chain supply and retail activity, but by flows into institutional vehicles that settle in spot BTC.
In this feature I walk through the recent large allocations that have signalled serious institutional appetite, explain the creation/redemption mechanics of IBIT and similar funds, unpack how ETF inflows and outflows interact with volatility and the derivatives market, and offer three data-driven scenarios for BTC's price over the next 6–12 months under differing macro and flow assumptions.
Recent institutional allocations: what moved the needle
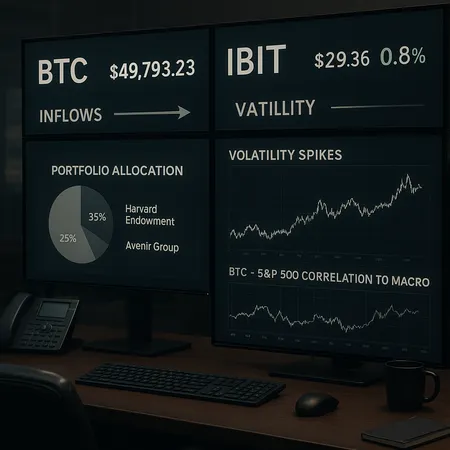
Two allocations in late 2025 crystallized something many market participants suspected: institutional portfolios are now allocating materially to spot Bitcoin ETFs. The Harvard endowment made headlines after taking roughly a $443 million position in BlackRock's iShares Bitcoin Trust (IBIT), a rare and notable allocation for a major university endowment reported by CoinDesk. Around the same time, Avenir Group expanded its IBIT exposure to roughly $1.18 billion, another clear datapoint showing continued institutional accumulation (The Currency Analytics).
Those headline numbers are important for two reasons. First, they demonstrate that decisions are being made at allocators with long-term liability profiles and governance — not only at opportunistic macro funds. Second, when institutions use regulated ETFs to gain exposure, the capital is funneled through market-makers and authorized participants (APs), which directly affects spot BTC liquidity and order flow.
Why Harvard and Avenir matter beyond the headlines
Large, visible allocations serve as a confidence signal for other institutional allocators and for large intermediaries (custodians, prime brokers) that were previously hesitant. When a university endowment or a wealth manager deploys capital into IBIT, counterparties tighten spreads and increase willingness to warehouse spot exposure — and that lowers transaction costs for the next tranche of inflows.
Those reactions can be self-reinforcing: initial ETF inflows compress liquidity frictions, which invites more flows, which in turn can move price and change volatility regimes.
Mechanics of IBIT and IBIT-like spot Bitcoin ETFs
To understand flow-driven price action you need to understand how spot ETFs actually convert cash orders into BTC exposure.
- Creation/redemption: Authorized participants aggregate investor orders into creation units and deliver cash (or occasionally in-kind assets) to the ETF issuer in exchange for ETF shares. The issuer or its custodian then sources the underlying BTC — often via OTC desks or through exchanges — and places it in cold custody.
- Arbitrage channel: If ETF shares trade at a premium to NAV, APs can buy spot BTC and create new shares, selling them into the ETF to capture the spread. The opposite happens when ETF sells at a discount. This arbitrage keeps ETF prices tethered to NAV, but the arbitrage itself is the mechanism that moves spot liquidity.
- Settlement and custody: Unlike futures or synthetic exposure, spot ETFs require actual BTC to be bought and stored. That means inflows translate to real purchases of coins, which amplifies the link between ETF flows and on-chain supply-demand measures.
IBIT (and its peers) therefore function as a bridge between institutional cash flows and the physical BTC market. That bridge can be wide and stable — or narrow and brittle — depending on market conditions and how willing APs are to warehouse inventory.
How ETF inflows and outflows amplify or dampen volatility
Spot ETFs change volatility dynamics in three interconnected ways:
Flow-induced price pressure: When sustained net inflows into spot ETFs occur, APs and market makers must acquire BTC to create units; when those inflows are large relative to available liquidity, buy pressure pushes prices higher and can reduce short-term sell-side depth. Conversely, forced redemptions during stressed conditions create concentrated selling pressure.
Liquidity depth and market-making risk: Market-makers absorb inventory in normal conditions. But under stress, they hedge and de-risk — widening spreads or stepping back. That shift can turn orderly outflows into sharp price moves. Recent coverage of ETF outflows highlights how such redemptions can coincide with macro risk-off and mounting inflation worries, creating a feedback loop between ETFs and BTC selling pressure (FXEmpire).
Correlation and cross-asset transmission: Large institutional ETF flows often ebb and flow with risk appetite. If institutions treat Bitcoin like a risk asset — buying in risk-on and selling in risk-off — then ETF flows will increase BTC's correlation to equities and credit. That linkage is already visible in periods when macro variables dominate price action; institutional adoption can make that correlation more persistent.
There is a countervailing effect: ETFs can also dampen intraday volatility. A deep, predictable buyer of last resort for allocators (the ETF wrapper) can smooth retail-driven whipsaws because a portion of demand now sits in a regulated pool rather than on exchange order books.
Practical mechanics in stressed episodes
When a redemptions wave hits, APs may be forced to sell in less-than-ideal venues, bridging via derivatives or using OTC blocks. That creates slippage. Additionally, hedging flows spill into futures and options markets, changing basis and implied volatility. Traders should therefore monitor not only raw ETF net flows, but also the futures spread and options skew for nascent stress signals.
Scenarios for BTC price over the next 6–12 months
Below are three deliberately-stated scenarios built around two main axes: (A) net ETF flows (sustained inflows, neutral, sustained outflows) and (B) macro backdrop (benign real rates vs. hawkish tightening / inflation surprises). I provide directional BTC outcomes and the flow assumptions behind them. For concreteness, translate net ETF flows into coin demand using the rule-of-thumb: $100 million of net ETF inflows buys roughly 2,000 BTC if BTC trades near $50k ($100m / $50k).
Bull — sustained institutional accumulation + benign macro
Assumptions
- Weekly net ETF inflows: $200–$500M sustained for months.
- Macro: disinflation continuing, real yields stabilizing or falling; equities rally.
- APs willing to warehouse inventory; spreads narrow.
Market mechanics and outcome Net weekly inflows of $200M–$500M add thousands of BTC demand per week (4k–10k BTC/week if BTC is near $50k), which over several months meaningfully reduces available free float. With derivatives markets dovish, funding rates stay low and long-dated option skew compresses. Under this path, BTC could see a strong re-rating as scarcity meets persistent demand: a plausible 6-month outcome is a 30–80% rise from late-2025 levels; over 12 months, a 60–150% rise is possible if flows remain steady and macro stays supportive. This scenario is the classic ETF-driven bull market: inflows beget tighter liquidity and higher realized volatility when selling occurs, but the overall trend is sharply higher.
Base — balanced flows and mixed macro
Assumptions
- Weekly net ETF flows: modest, $0–$150M, with episodic weeks of inflows and occasional outflow weeks.
- Macro: choppy — occasionally hawkish data, occasionally benign.
Market mechanics and outcome In this more balanced world, ETF demand is an incremental bid that smooths retail noise but doesn't create a persistent liquidity squeeze. BTC's correlation to equities rises modestly during risk-off windows, but APs generally manage inventories and liquidity remains adequate. Expect a 6-month range of -10% to +25% and a 12-month range of -5% to +40% from late-2025 levels — essentially a market where BTC behaves more like a risk-on beta with occasional spikes around flow imbalances.
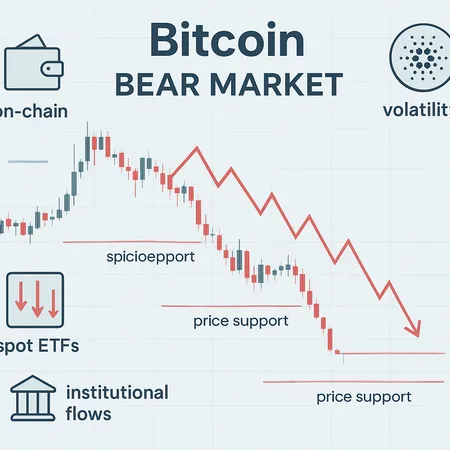
Bear — rapid redemptions and hawkish macro shock
Assumptions
- Weekly net ETF outflows: $200M+ sustained for multiple weeks.
- Macro: sticky inflation surprise or sudden equity drawdown leading to rapid risk-off.
Market mechanics and outcome A wave of redemptions forces APs and market-makers to liquidate spot BTC into thinner books, producing outsized price moves. Derivatives hedging exacerbates selling as futures basis widens and funding turns negative, and option skews spike. Combined with higher real yields, this can precipitate fast, deep drawdowns — a plausible 6-month outcome: -30% to -60%; over 12 months: -40% to -70% if redemptions persist and the macro backdrop remains hostile. Past episodes show that ETF-led selloffs can be amplified by liquidity mismatches.
What institutional investors should watch (and how to measure it)
If you manage or advise institutional capital, the key monitoring list should include:
- Net ETF flows: the single clearest short-term signal of directional pressure. Convert dollars to coins to understand the scale of spot demand.
- AP inventory signals and ETF secondary market spreads: persistent premiums/discounts flag arbitrage strain.
- Futures basis and funding rates: widening basis suggests hedging stress; funding spikes show levered positioning.
- Options skew and put-call ratios: rising skew warns of one-sided downside demand for protection.
- On-chain liquidity metrics: exchange balances, OTC desk inventory and large wallet movements can anticipate where supply will appear.
- Macro indicators: real yields, CPI prints and equity volatility (VIX) — because institutional ETF flows tend to move with broader risk appetite.
For sophisticated retail readers and allocators, platforms that aggregate order flow or provide structured access (and not purely speculative venues) matter; niche infrastructure providers — and even consumer-focused platforms such as Bitlet.app — illustrate how access layers are evolving, though institutional custody and execution remain distinct in risk and settlement.
Conclusion: a new regime with old tail risks
Spot Bitcoin ETFs have changed the game: flows are now a first-order driver of spot liquidity and price discovery. Institutional allocations like the Harvard endowment's stake and Avenir's expansion are more than headlines — they are structural evidence that capital will likely continue to route into regulated vehicles, directly linking macro cycles and ETF flows to BTC price dynamics. That linkage can both stabilize day-to-day noise and exacerbate stress episodes when outflows collide with thin spot liquidity.
The practical takeaway for allocators: monitor flows, basis and skew, and build position and liquidity plans that survive both steady inflows and sudden redemptions. As ETFs mature and new products (and competitors listed in primers of funds to watch) jockey for flow share (CryptoTicker’s primer), the market will likely alternate between periods of orderly accumulation and episodes where ETF mechanics amplify moves. Understanding that plumbing — and the human decisions behind allocations — is now as important as reading on-chain charts.