Why XRPC's Record Inflows Came with an XRP Price Drop — Liquidity, ETF Mechanics, and What Comes Next
Summary
Introduction — the XRPC paradox
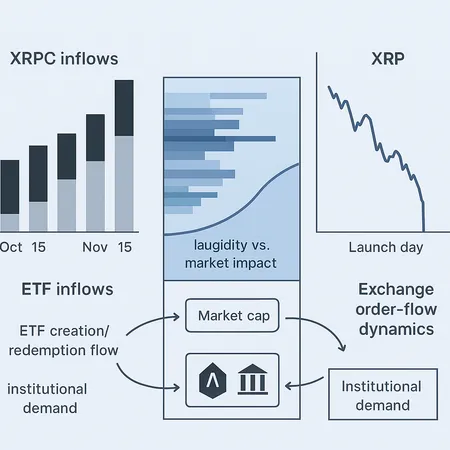
The first spot XRP ETFs — led by the XRPC “canary” product — recorded record inflows and extremely high volumes, yet early trading saw XRP drop sharply before recovering. That disconnect looks counterintuitive: why would big demand into an ETF coincide with falling spot prices? The short answer: inflows ≠ instantaneous, frictionless buys of underlying liquidity; the longer answer requires unpacking liquidity math, ETF plumbing and real-world order flow.
On launch day market reports captured both sides of the story: a heavy initial sell-off and a high-volume reversal later in the session (CoinDesk’s recap documents the intraday dynamics), while on-chain trackers showed a staggering short-term spike in spot activity — nearly 2,490% in one reporting window (U.Today). These observations are not contradictory once you map each flow to the actors and mechanics behind them.
Liquidity math: supply, depth and market impact
Price moves are functions of available liquidity versus order size. Two simple but practical relationships help explain the paradox:
Daily inflow magnitude vs. free float: even a large ETF subscription can be small relative to XRP’s circulating supply and, more importantly, relative to liquid sell-side inventory. A $100M inflow looks very different if it needs to be placed into an order book with only $20M usable depth at the best 1% levels.
Square-root market impact (rule-of-thumb): many empirical studies suggest price impact scales roughly like sigma * sqrt(Q / V), where Q is the trade size and V is daily volume. That means as trade size approaches or exceeds typical daily volume, marginal impact grows sublinearly but still meaningfully.
Put simply: when inflows hit a thin order book, the act of buying (or hedging against that buy) can push price down temporarily, especially if macro or cross-market flows—like a weakening Bitcoin session—are already nudging sellers to take profits.
ETF mechanics that mute or invert spot price effects
Not all ETF subscriptions translate into straightforward spot buys. Key plumbing elements to understand:
Authorized Participants (APs): APs create and redeem ETF shares. They often hedge exposure by selling the underlying in spot markets when they create ETF shares via cash creations, or they deliver in-kind baskets when that’s allowed. The net spot flow depends on the creation method and the AP’s hedging strategy.
Cash vs. In-kind creations: Cash creations require APs to buy spot (or synthetic exposure) to hedge. In-kind creations deliver underlying tokens and are less disruptive; however, many providers manage inventory centrally and still use spot or OTC trades to balance exposures.
Timing and settlement lag: ETF subscriptions on launch day can be processed in batches, and AP hedges can be algorithmic — only gradually executed to minimize market impact. But during volatile windows, APs may use derivatives to hedge immediately, leading to selling pressure in spot as liquidity providers unwind hedges.
Arbitrage and market makers: ETF pricing and NAV differentials incentivize APs and market makers to short or hedge the cash product while acquiring the underlying later, creating temporary mismatches between ETF flows and spot purchases.
These mechanisms can mean that an ETF’s headline inflows show demand, while net spot buying is delayed, staged, or even reversed by hedging and arbitrage.
Order-flow dynamics on launch day: who sold and why?
Several distinct buckets of selling pressure can explain the drop during XRPC’s launch sequence:
Pre-emptive profit-taking — traders who front-ran the ETF narrative may have used the launch as an opportunity to realize gains; high turnover begets liquidity but creates initial seller imbalance.
Hedging-induced selling — APs and market makers often employ derivatives (futures, swaps) to hedge ETF creation risk. Delta-hedging and gamma adjustments can require incremental spot selling, especially if the derivative curve moves.
Liquidity vacuum at key levels — price discovery during a new product often finds poor depth at the most-watched price points. Even modest sell prints can cascade into larger moves when stop orders and algos trigger.
Cross-market stress — weakness in larger markets (BTC/USD or macro risk-off) can make liquidity providers widen spreads or withdraw, meaning the same sell quantity has a bigger impact.
CoinDesk’s market recap highlighted exactly that confluence: early weakness amplified a technical sell cascade, and only later did buyers step in to absorb inventory as realized volatility and liquidity stabilized.
Canary ETFs and the signal vs noise problem
Canary ETFs like XRPC function as both an investment vehicle and a market test. Their record volumes (reported by Coinpedia) are real, but they also act as a signal that attracts speculators, arbitrage desks and smaller APs eager to profit from price dislocations and to prove strategies ahead of larger entrants like BlackRock (Coinpedia analysis). That breeds amplified intraday flows and higher churn.
Meanwhile, on-chain flow spikes such as the 2,490% jump reported by U.Today are useful: they reveal activity but not the directionality or ultimate ownership changes. Large on-chain transfers can be internal swaps, AP balancing moves, or custodial flows that do not equate to net new investor demand for the token in the liquid market.
What to expect from the next wave of spot XRP ETFs
The entrance of heavyweight issuers (BlackRock, others) tends to change dynamics in predictable ways:
Bigger AP networks and deeper OTC desks: larger issuers can route creations through more established liquidity providers, smoothing execution and reducing intraday stress.
Cash vs. in-kind policy differences: larger managers may negotiate in-kind facilities or have better custody partners, which reduces forced spot selling. But their size also means larger nominal creation sizes, which can stress liquidity if not staged.
More sophisticated hedging and inventory management: institutional desks will likely use more complex cross-venue hedges, which could reduce immediate market impact but introduce correlated flow behaviour across exchanges and derivatives markets.
Industry coverage on which issuer will be next underscores both the competition and the operational trade-offs — more entrants generally increase long-term absorptive capacity for demand, but near-term launch windows remain vulnerable to microstructure surprises (CryptoPotato’s roundup).
Practical frameworks for traders and institutional allocators
Below are actionable frameworks and signals to reconcile ETF inflows with price action.
- The 5-Metric Dashboard (real-time):
- Creation/Redemption Rate (shares/day): Are creations net positive? High net creations with little spot buying are a red flag.
- Exchange On-Chain Balances (XRP on exchanges): Falling balances + high inflows = genuine tightening.
- Bid-Ask Depth at 0.5–1%: How much notional buys the top-of-book?
- AP/OTC Block Trade Alerts: Large OTC prints suggest off-book matching that won't show in order books immediately.
- Derivatives Flows (BTC/XRP futures basis, funding rates): Abrupt hedging can cause spot selling.
- Trade playbook by scenario:
- Scenario A — Heavy inflows, rising depth, falling exchange balances: constructive. Consider size-scaled long exposure or staggered accumulation.
- Scenario B — Heavy inflows, stagnant depth, rising short-dated futures open interest: cautious. Expect volatility; use options for asymmetric exposure or small, layered entries.
- Scenario C — Heavy inflows but AP hedging visible via derivatives selling: avoid one-sided bets; fade intraday spikes until hedges settle.
- Position sizing & execution rules for allocators:
- Favor VWAP/TWAP execution when transacting allocations linked to ETF flows.
- Use OTC liquidity providers for large buys where possible; avoid routing large buys into thin spot books.
- Maintain a stress-test runbook: What happens if the AP network withdraws for 24–48 hours? Model market-impact costs using square-root and set slippage thresholds.
- Sentiment & signal triangulation:
- Don’t treat on-chain inflow spikes as unilateral buy signals—triangulate with NAV premiums/discounts, AP announcements, and derivatives hedging activity.
- Monitor ETF price vs NAV gaps: persistent discount/premium tells you whether ETF is absorbing or distributing supply.
Example checklist to interpret a launch-day print
- Is the inflow an actual creation or just a subscription order? (creations matter)
- Are APs hedging via futures or selling spot? (watch basis/funding)
- Are exchange balances falling? (on-chain confirmation of supply pull)
- What is the 1% market-depth notional? (compare against creation size)
- Is the NAV vs secondary market showing a premium? (arbitrage window presence)
Use these answers to choose between layered accumulation, options-based hedges (buying calls or call spreads), or staying on the sidelines until liquidity normalizes.
What traders and allocators should watch next week
- XRPC creation cadence and any shifts in cash vs. in-kind language from providers.
- Block trade prints and AP public activity — larger players often issue operational notes.
- Options skew and short-dated IV spikes — they presage hedging flows.
- Exchange order-book depth at key psychological levels; thin depth is a red flag for larger buys.
Bitlet.app users and institutional allocators should integrate these real-time signals into execution algorithms and risk limits to avoid paying outsized market-impact costs.
Conclusion — reconcile signal with plumbing
Headline inflows and record volumes from the XRPC canary ETF did not immediately translate into a clean, upward move for XRP because liquidity and mechanics matter. Inflows are important — they are long-term demand — but on a launch day with shallow depth, derivative hedging, AP behavior and cross-market stress can produce transient selling pressure.
Looking forward, larger issuers will bring smoother execution and more absorptive capacity, but they also introduce different flow dynamics. Traders and allocators who use a disciplined framework — focusing on creation/redemption rates, exchange balances, AP behavior and market depth — will be better positioned to interpret ETF inflows versus spot price moves and to size trades accordingly.
If you want a practical template, start with the 5-Metric Dashboard and the three-scenario trade playbook outlined above, then adapt thresholds to your risk budget and the specific liquidity profile of XRP. The paradox is solvable: with the right metrics and execution discipline, what looks like noise becomes actionable information.