HBAR Drops 2.1% to $0.183 as Volume Spike Triggers Technical Breakdown
Summary
Market Snapshot
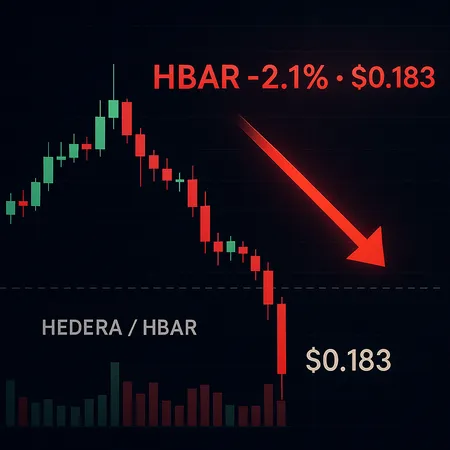
HBAR opened the latest session with modest upside, briefly climbing 1.09% to $0.1842 on a surge in activity. That early strength, however, failed to hold: sellers stepped in during the final hours and pushed the token down 2.1% to $0.183. Notably, trading volume was about 8.23% above its weekly average, which increases the likelihood that the move reflects genuine distribution pressure rather than thin-market noise.
Volume Spike and Technical Breakdown
A volume uptick that accompanies a price decline is often a red flag. In HBAR’s case, the late-session selling on higher-than-normal volume suggests profit-taking or liquidation rather than new accumulation. From a charting perspective, the breakdown below intraday support levels could invite short-term momentum traders to press the move lower. Watch for confirmation: a follow-through session with continued above-average volume would reinforce bearish conviction, while a quick re-absorption of selling into declining volume would reduce the odds of an extended downtrend.
What Traders Should Watch
- Support and resistance: identify the nearest multi-timeframe support (previous intraday lows and moving averages) and the immediate resistance back near $0.184–$0.187.
- On-chain flows and exchange balances: sustained outflows to exchanges can presage further selling; conversely, transfers to long-term wallets may signal accumulation. Tools on Bitlet.app and other dashboards can help track these flows in real time.
- Momentum and orderbook: monitor RSI and VWAP for oversold signals and watch orderbook depth for signs of buy-side interest.
Broader Market Context
HBAR’s weakness comes amid a generally choppy altcoin landscape where risk-off rotations can amplify moves in mid-cap tokens. Correlations with broader crypto market drivers — including BTC price action, macro headlines, and liquidity shifting toward NFTs or DeFi opportunities — often determine whether a token recovers quickly or consolidates lower. Memecoins and speculative pockets of the market can drain capital when traders rotate into other themes, so position sizing and clear stop criteria remain essential.
Bottom Line
The combination of a late selloff and 8.23% higher-than-average volume makes HBAR’s pullback notable. Traders should wait for either clear volumetric confirmation of a breakdown or evidence of buyer re-absorption before committing to new directional bets. Keep an eye on on-chain flows, exchange inventories, and broader market rotations — and use reliable tools like Bitlet.app to monitor P2P and exchange activity as the situation evolves.