Why Ethereum’s Macro Sensitivity Helped Drive the $2,200–$2,250 Rebound
Summary
Executive snapshot
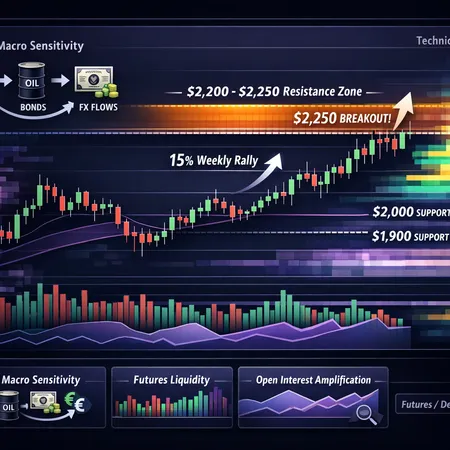
Ethereum’s recent 15–20% weekly rally brought ETH back above the psychologically and technically important $2,200 mark and tested the $2,250 area. That rebound wasn’t just a clean technical bounce; it arrived alongside rising futures activity, changing open interest profiles and cross-market liquidity shifts that suggest ETH is increasingly behaving like a macro-driven risk asset rather than an isolated on-chain story. For intermediate traders and crypto macro analysts, the key is to read how futures and macro liquidity are amplifying moves — and to convert these observations into tradeable setups.
Why talk about macro sensitivity now?
Over the past year, a growing body of analysis has documented how Ethereum’s price is reacting to macro flows: commodities, FX, and bond liquidity influence futures desks and prop flow, which in turn sets the tone for crypto futures positioning. A useful primer on this trend maps how futures liquidity and macro drivers — including oil and cross-asset flows — increasingly dictate directional moves for ETH rather than purely on-chain demand or application growth. See the detailed analysis linking ETH to broader liquidity conditions in this report: Mapping Ethereum’s Macro Sensitivity.
In short: when macro liquidity loosens or risk appetite returns, futures desks and allocators often rotate into crypto with large, leveraged positions. That flow shows up as rising open interest (OI), widening basis, and directional funding — all of which make price moves larger and faster.
The market picture behind the 15–20% weekly rally
Technically, the move into $2,200–$2,250 combined several elements:
- A clear reclaim of the $2,200 level that had acted as resistance in prior attempts (reported in price coverage of the recovery) ETH reclaims $2,200.
- An approach to a higher resistance shelf near $2,250 where prior liquidity and stop clusters exist — a zone that, if taken decisively, signals a change in control from sellers to buyers (see the technical breakdown in the $2,250 breakout analysis) Breakout and key support levels.
- Momentum in the futures complex: open interest and notional flow expanded as the rally progressed, indicating fresh money rather than purely short-covering — a point emphasized by price analysts who flagged a ~20% rally into key resistance 20% rally approach.
Put together, these factors explain why the move felt both strong and brittle: strong because fresh leverage entered; brittle because that same leverage can reverse violently if funding turns or macro liquidity withdraws.
How futures positioning and open interest can amplify moves
Futures markets are the accelerant for modern crypto moves. Here are the mechanics you need to track and what they imply:
Open interest (OI) rising with price: indicates fresh directional exposure. If OI climbs while price rises, the market is adding net longs (or longs are adding leverage). This increases vulnerability to long liquidations, but it also validates momentum continuation while the flows persist.
OI falling during rallies: often signals short covering or deleveraging, which can make moves look strong but less sustainable — a rally without fresh participation.
Funding rate dynamics: positive funding (longs pay shorts) suggests long dominance and a cost for maintaining long exposure. Very high positive funding invites short-sellers or incentivizes short builders who can trigger squeezes.
Basis and perpetual premium: a widening premium between perpetual swaps and spot often indicates marginal demand from leveraged retail or desks. Rapid changes in basis presage volatility as players rush to hedge delta.
Concentration of stops and liquidations near round numbers ($2,200 / $2,250): clustered stops are fuel. When the market pokes these levels it can cascade into large, short-term moves.
In practice, rising OI and positive funding during the recent rebound suggested real money was piling into longs — not only short-covering — which supports a continuation scenario while the macro backdrop stays supportive. Conversely, if macro liquidity withdraws (for example, a sudden USD strength episode or a bond-market shock), leveraged longs are the first to be hit.
Reading macro signals that matter for ETH
Macro inputs to watch (and why they matter):
- FX and Dollar action: a weaker dollar generally frees risk-on flows; flows into risk assets can show up in crypto futures desks increasing net long exposure.
- Commodities (oil) and cyclicals: commodity strength often tracks broader liquidity and inflation expectations that influence risk premia and allocations to crypto.
- Rates and bond flows: a big move in yields or central bank communication can shift funding costs, liquidity, and cross-asset hedge behavior, which cascades into crypto futures activity.
Ambcrypto’s mapping of ETH’s sensitivity to oil and liquidity is a good reminder: crypto desks operate inside a broader liquidity ecosystem. Watch macro news and short-term liquidity metrics alongside your ETH charts.
Technical levels and market structure: what to watch
Key levels (contextual, for intermediate traders):
- Immediate support: $2,200 — reclaimed and now acting as the first line of defense.
- Near-term support below that: $2,000 — a round number where longer-term holders and option strikes often cluster.
- Deeper support: $1,800 area — a structural zone that would indicate a larger failure of the recent recovery if lost.
- Immediate resistance: $2,250 — the breakout shelf that confirms momentum if taken decisively.
- Next resistance: $2,400–$2,600 — extension targets on a clean breakout with expanding OI.
Market structure notes: reclaim of $2,200 shifted short-term control to buyers; however, the $2,250 area contains prior liquidity and option interest, so the market often needs a sustained increase in bid depth and positive macro/futures signals to close above it with conviction.
Trade-ready setups
Below are concrete setups for two trader profiles: momentum players and mean-reversion (MR) players. Each setup includes entries, stops, targets and the market context that should validate the trade.
Momentum setup (trend-following)
- Rationale: Enter when price closes decisively above $2,250 with rising open interest and sustained positive funding — signal that fresh long money is backing price.
- Entry: Break-and-close above $2,250 on 4H or daily timeframe with OI up at least 5–10% over 24–72 hours.
- Stop: Initial stop under the breakout candle low or under $2,150 (tighten trailing stop as price moves).
- Targets: Partial target at $2,400; add-on target range $2,600–2,800 if OI and funding remain supportive.
- Risk controls: Use position sizing so that a stop hit is no more than 1–2% of account; reduce size if funding is >0.05% per 8 hours (high carry cost).
- Confirmation checklist: rising OI, persistent positive funding (but not extreme), macro liquidity stable/positive.
Mean-reversion setup (fade into resistance)
- Rationale: Fade price into the $2,250 resistance shelf when the move looks stretched and OI increases but funding spikes (implying crowded longs vulnerable to squeeze).
- Entry: Short into the $2,240–$2,270 zone on a failed re-test or bearish intraday signal (e.g., bearish divergence on RSI/24h volume drop) with OI rising but funding above 0.03%.
- Stop: Tight stop above $2,300–$2,320 depending on aggressiveness.
- Targets: $2,050–$2,000 for the first take-profit; deeper targets toward $1,900–$1,800 if momentum breaks and OI collapses.
- Risk controls: Small position relative to momentum strategies; be prepared for volatility spikes due to squeezes — use limit entries and stagger stops.
- Confirmation checklist: rising OI with sharply rising funding, macro cross-asset warning signs (e.g., USD strength), and on-chain outflows from exchanges.
Tactical scalps and options overlay
- Scalpers: Look for fade/retest moves on 1H when basis compresses or funding turns quickly; keep position time short and use tight stops.
- Options players: Buying calls after a confirmed $2,250 daily close (V-call) or selling premium (put spreads) if you expect mean reversion — always size for potential vol crush.
Practical monitoring checklist (real-time cues)
- Open Interest: rising OI with price up = momentum validated; OI falling with price up = less sustainable.
- Funding rates: persistently positive and rising funding increases squeeze risk.
- Basis/perpetual premium: widening premium signals marginal retail/leveraged interest.
- Macro headlines: any surprise in rates, FX, or commodity markets can quickly change liquidity posture.
- On-chain flows: large exchange inflows can signal selling pressure; outflows can support price.
Use Bitlet.app or your preferred futures dashboard to surface these metrics in real time and to size/manage trades accordingly.
Managing the asymmetry: sizing and scenario planning
The same leverage that accelerates gains will amplify losses. Practical rules:
- Cap retail leverage: avoid >5–10x unless you are explicitly trading squeezes.
- Scale in and out: take partial profits at the first target and let a reduced position run.
- Event risk: shrink size around macro events (central bank announcements, major data prints) when cross-asset liquidity can reverse.
- Keep a watchlist of correlated assets (BTC, tech equities, oil) that might lead or confirm cross-market rotation.
Closing thoughts
The $2,200–$2,250 zone is now a litmus test for whether ETH’s recent rebound has structural legs or is a liquidity-fueled blip. Futures metrics — open interest, funding, and basis — combined with macro liquidity cues will decide the next leg. For intermediate traders, the edge comes from reading those signals together and matching them to a clear, rule-based trade plan: momentum traders lean into breakouts confirmed by rising OI and stable macro flows; mean-reversion traders look to fade crowded longs when funding spikes and macro risk rises.
Sources
- Mapping Ethereum’s Macro Sensitivity — Ambcrypto
- Ethereum ~20% rally analysis — BeinCrypto
- Ethereum reclaims $2,200 — CryptoNews
- Ethereum $2,250 breakout and support levels — CryptoTicker
For further reading, check how broader narratives about on-chain activity, memecoins and DeFi rotation can interact with futures flows — for instance, on the platform’s blog pages like Ethereum and DeFi.