Altcoin Correction: Diagnosing AVAX, SHIB, PI — Causes, Recovery Targets, Trader Playbook
Summary
Executive overview
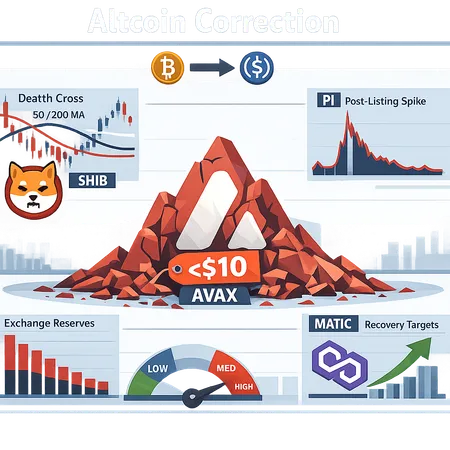
The last few weeks have been an object lesson in how correlated risks — exchange reserves, leverage, and macro capital rotation — compress into sharp altcoin corrections. AVAX slipping under the $10 handle captured headlines, SHIB printed a daily death cross as exchange reserves surged, and PI erased post‑listing gains in a familiar listing‑volatility pattern. For active altcoin traders and portfolio risk managers, these episodes are less about panic and more about reading which sell‑offs are temporary washouts and which signal deeper structural trouble.
Below I diagnose the shared drivers behind these moves, offer short‑term technical recovery targets (and realistic timeframes) for AVAX, MATIC and SHIB, and give a repeatable framework to triage underperforming tokens.
Common drivers: why so many altcoins fell at once
Three forces have repeatedly aligned to amplify downside in altcoins:
Exchange reserves and visible supply overhang. When large token volumes flow to exchanges or exchange reserves climb, selling pressure grows because tokens are now positioned where execution is easy. That dynamic is part of why Shiba Inu’s recent weakness looked less like a technical blip and more like supply catching up to demand — analysts flagged a surge above 80 trillion SHIB on exchanges as a red flag for available supply and potential selling pressure (Coinpaper).
Leverage and liquidity spirals. Derivatives leverage and tight liquidity corridors create a feedback loop: small price moves trigger liquidations, which push prices further, triggering more liquidations. This mechanism has surfaced across AVAX and other mid‑cap alts when funding rates and open interest spike and then reverse.
Macro risk and capital rotation into BTC/USDC. In risk‑off moments, capital tends to rotate back into Bitcoin or stablecoins. That exodus reduces liquidity for altcoins and concentrates selling into the most liquid venues. Traders chasing safety can briefly widen spreads and increase execution slippage for smaller tokens — think of it as a liquidity tax.
These drivers are rarely independent: rising exchange reserves make liquidations more likely, which in turn feeds macro rotation. The AVAX, SHIB and PI episodes each illustrate one or more parts of this pattern.
Case studies: AVAX, SHIB, PI — what happened and why
AVAX: a psychological break under $10 plus liquidity squeeze
Avalanche (AVAX) recently fell below the $10 psychological level, a notable technical event that invited momentum sellers and algorithmic exits. Reporting on the move identified both technical resistance breakdown and diminished buying depth around the $10 zone as triggers (CoinPedia coverage). Practically, once a round number fails and larger wallets or market makers step back, order books thin and the path of least resistance becomes downside.
What made AVAX especially vulnerable: it's a liquid mid‑cap token with a meaningful futures market, so funding and liquidations mattered; and the psychological $10 threshold concentrated stop orders just beneath it. When those stops hit, the velocity of the move increased.
SHIB: technical death cross + swelling exchange reserves
Shiba Inu (SHIB) printed a daily death cross — the 50‑day moving average crossing below the 200‑day — a classic intermediate‑term bearish signal that often coincides with prolonged weakness. At the same time, exchange reserves passed above 80 trillion SHIB, a clear supply‑overhang signal that raises the probability of sustained selling pressure (U.Today on the death cross; Coinpaper on reserves).
The combination is important: technical momentum turned negative at the same time available supply spiked. That pairing favors a longer cleanout phase unless on‑chain flows show concentrated accumulations outside exchanges.
PI: the classic listing spike and post‑listing reversion
PI’s token saw a quick pop on exchange listing hype and then erased most gains — a common pattern when an event (like a Kraken listing) pushes illiquid tokens into concentrated hands and traders rush to take profits. A recent article documented the PI token erasing gains after a listing‑driven spike, underscoring how new‑listing volatility is often short‑lived and dominated by distribution and liquidity mismatches (CryptoPotato report).
Listing events often reveal true order book depth. If bids are thin, early sellers can compress price quickly. For PI, the lesson is straightforward: newly listed tokens frequently need a multi‑week consolidation period before they establish a durable price floor.
Short‑term technical recovery targets and timeframes (practical playbook)
Below are pragmatic, short‑term levels and realistic timeframes for active traders. These are not investment guarantees but tradeable waypoints to watch when sizing entries or exits.
AVAX — levels and timing
- Initial bounce target: $11–$12. Expect a short‑term relief rally to test this zone as stop‑hunters and short‑covering unwind. This can occur within days to 2 weeks if macro volatility cools.
- Medium recovery target: $14–$16. A sustained bounce above this band signals re‑accumulation and reduces the likelihood of a retest of prior lows. That may take 2–8 weeks and requires improving order‑book depth and reduced exchange inflows.
- Structural reclaim: Above $18–$20 would be needed to argue the correction is over in a broader sense — a longer timeframe (several weeks to months) depending on BTC direction and network fundamentals.
These targets mirror the technical narrative reported around AVAX’s $10 break and the common two‑step recovery process (initial short squeeze, then higher resistance test) described in recent analysis (CoinPedia).
MATIC — cautious recovery bands
Polygon (MATIC) is trading with clear resistance levels where a successful reclaim signals a controlled recovery. Recent technical writing placed cautious recovery targets near $0.45–$0.52 if key resistance holds; traders should view the lower bound as the first confirmation and $0.52 as the next level of conviction (Blockchain.News analysis).
- Short window: expect tests of $0.45 inside 1–3 weeks if market structure stabilizes.
- Medium window: $0.52 within 3–8 weeks assuming broader risk appetite returns.
SHIB — moving‑average and supply checks
Because SHIB is measured in token supply rather than a high nominal price, use moving averages and supply metrics for guidance:
- Initial technical reclaim: retake of the 50‑day MA on the daily chart — that would be a signal for tactical traders to scale back into exposure.
- Medium recovery: clearing the 200‑day MA and a sustained decline in exchange reserves (net outflows from exchanges) would shift the bias more bullish.
- Timeframe: death crosses typically take weeks to months to resolve; expect a multi‑week consolidation, with months required to meaningfully reverse a supply‑driven narrative.
Caveat: unless exchange reserves decline materially from current highs, rallies are likely to be capped by available selling.
PI and newly listed tokens — volatility rules
- Rule of thumb: after a listing spike, wait for a liquidity‑driven consolidation (often 2–6 weeks) before committing sizeable capital.
- Targets: look for a stable bid / reduced spread and consistent on‑chain accumulation; use percentage rules like waiting for a 20–30% retracement from the listing peak on thinly traded tokens.
New listings often create a tale of two markets: hype‑driven paper gains followed by a rapid realization phase. Use the PI episode as a reminder that liquidity, not narrative, determines short‑term price durability.
A practical triage framework: how to tell a transient washout from a structural decline
Below is a checklist traders and risk managers can run through quickly when a token falls hard.
Exchange reserves and netflow direction — Are exchange balances rising or falling? A sustained inflow to exchanges signals potential selling; outflows to cold wallets can mean accumulation. Use exchange reserve counts for immediate sizing decisions.
Derivatives metrics: open interest & funding rates — Falling OI and negative funding often mean shorts are dominant; rapid swings in funding can presage liquidations. Large, concentrated futures exposure raises the risk of amplified moves.
Orderbook depth and bid‑ask spreads — Thin bids at wider spreads indicate fragile liquidity. A token that falls through several layers of liquidity is more likely to be a structural repricing event.
On‑chain holder behavior — Are large wallets transferring to exchanges? Are token locks/vesting cliffs imminent? Whale redistribution to exchanges is a red flag.
Correlation to BTC and macro variables — If the token falls while BTC is flat, that’s a token‑specific issue. If BTC is also selling, the move may be macro driven and more likely to reverse when macro risk subsides.
Fundamentals & protocol health — TVL, active users, development commits and revenue (if applicable). A protocol with eroding usage is more likely in structural decline.
Event risk and narrative exhaustion — Hype‑driven rallies (listings, token unlocks, NFT drops) can exhaust buyers quickly. Confirm whether the catalyst is repeatable.
Crowdedness & concentration — High holder concentration or staking centralization increases systemic risk if a few actors decide to exit.
Apply the checklist to separate scenarios. Example: SHIB has both technical sell signals and rising exchange reserves (two red items) — bias: structural risk until exchange flows cool. AVAX broke a psychological level and showed liquidity gaps, but if exchange outflows resume and futures funding stabilizes, it may be a transient washout.
Risk management and trade execution checklist
- Size positions to the level of liquidity risk: smaller notional sizes for low‑liquidity tokens.
- Use scaled entries: stagger buys at several bands rather than a single entry.
- Prefer limit orders in thin markets to avoid payoff to predatory liquidity takers.
- Keep stop sizes proportional to average true range (ATR) in volatile alts; avoid fixed percent stops that ignore volatility structure.
- Hedge with inverse futures or BTC hedges when macro correlation is high.
- Monitor exchange reserves and derivatives dashboards daily — these are leading signals.
Platforms like Bitlet.app can be useful for execution and monitoring, but always validate liquidity snapshots on the destination exchange.
Putting it together: a sample triage on AVAX today
- Check exchange reserves: are they rising? If yes, reduce size.
- Look at futures OI and funding: extreme negative funding suggests short squeezes could fuel rallies but also more violent drops.
- Observe orderbook depth across top centralised exchanges: thin bids = smaller position sizing.
- If AVAX holds $11–$12 on intraday bounces, consider a staged add with a target to take partial profits into $14–$16.
- If AVAX fails to reclaim $11 within two weeks and exchange reserves remain high, switch to defensive posture and tighten stops.
Final thoughts — the operational edge
Altcoin corrections are painful, but they’re also predictable when you monitor the right signals: exchange reserves, leverage metrics, liquidity depth and macro flow. The recent episodes with AVAX, SHIB and PI are textbook reminders that sentiment, supply and leverage often move together.
For active traders and risk managers: make these signals routine checks in your pre‑trade playbook. Distinguish between liquidity‑driven washouts (short windows to buy) and fundamental/supply shocks (longer remediation, more cautious sizing). That discipline — not bravado — is how you preserve capital and capture asymmetrical upside when the market normalizes.
Sources
- AVAX price drops below $10 — CoinPedia
- Shiba Inu death cross coverage — U.Today
- PI token erases gains post‑listing — CryptoPotato
- MATIC cautious recovery targets — Blockchain.News
- SHIB exchange reserve surge analysis — Coinpaper
For context on market leadership and rotation, remember that macro flows often push capital into Bitcoin or stablecoins—which in turn changes the risk profile for DeFi and altcoins. Stay systematic, watch the flows, and let liquidity tell you how large to be.


