Solana: Death Cross vs. Institutional ETF Demand — Trading the Tension in SOL
Summary
Market snapshot: the paradox traders face
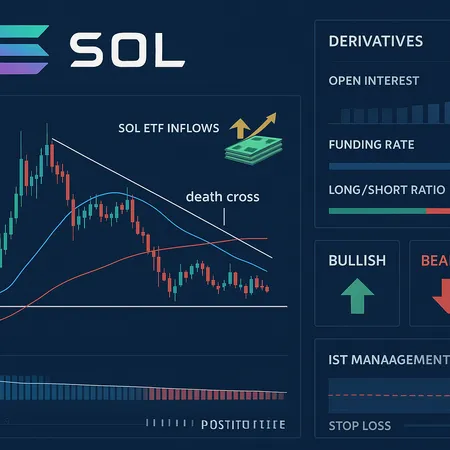
Solana (SOL) sits at an uncomfortable crossroads: technical charts flashed a death cross — a widely watched bearish crossover — even as institutional demand via SOL ETFs appears to be holding steady. A recent technical report highlighted the death cross at roughly the same time that cumulative ETF flows were being reported near $400 million, creating a classic tug-of-war between price momentum and capital flows (Invezz technical report).
Active traders and portfolio managers need to reconcile two things: technical analysis that favors caution, and flow-driven support that can sustain bounces or mask weakness. Platforms like Bitlet.app show how retail and institutional tools are converging — but the signal you trade should depend on your timeframe, risk tolerance, and whether you intend to hedge using derivatives.
What a death cross signals (and what it doesn’t)
A "death cross" typically refers to the 50-day moving average crossing below the 200-day moving average. In equity and crypto markets it is treated as a medium-to-long-term bearish signal because it means recent price action is, on average, weaker than the longer-term trend. Practically, the death cross implies momentum has shifted and that mean reversion to the downside is more likely than not over the coming weeks to months.
That said, the death cross is a lagging indicator:
- It reflects past price action and often completes after much of the decline has already occurred. Traders who only react to the crossover risk entering late.
- It can produce false signals in markets where capital flows or macro narratives change quickly. Crypto has a history of prolonged bull markets where moving averages cross and re-cross without triggering structural bear markets.
- The magnitude and follow-through matter. A death cross followed by rising volume and expanding open interest is more concerning than one that happens quietly on low volumes.
So, treat the death cross as a bias — a higher probability of continued softness — rather than a timing trigger by itself.
Why SOL ETF inflows can decouple price from on-chain fundamentals
Institutional inflows into SOL ETFs alter the demand equation. When asset managers accumulate via ETFs, they create persistent buying pressure that can sustain or lift the ETF share price even if on-chain activity or retail demand wanes. Several analysts have observed this pattern: despite price weakness, institutional demand into Solana ETFs looks steady, and derivatives flow suggests traders are sniffing out early support (TokenPost analysis, The Currency Analytics coverage).
Key ways ETF demand changes the dynamics:
- Size and persistence: Institution-sized purchases are large and repeatable, creating a baseline of demand that can absorb retail selling.
- Timing mismatch: ETFs often accumulate over days or weeks to meet mandate objectives, meaning inflows can lag or lead price appreciation.
- Market structure effects: ETF creation/redemption mechanics and AP (authorized participant) activity can shift liquidity from spot venues to OTC desks and derivatives markets.
As a result, the market can show a stretched dislocation where technicals look bearish while flows and derivatives are signaling buy-side accumulation.
Reading derivatives for a clearer short-term picture
Derivatives provide a more immediate snapshot of trader conviction and can help resolve the death cross vs. flows debate. Focus on three metrics:
- Funding rates (futures): Positive funding means perpetual longs pay shorts — a sign of leveraged bullishness. Negative funding shows short pressure and/or a lack of long leverage. Persistent positive funding in the face of a death cross suggests real money or leveraged traders are trying to push prices up.
- Open interest and liquidations: Rising open interest with price declines indicates new shorts are being initiated; falling open interest on declines suggests positions are being closed and that the selling could be exhausted.
- Options skew and put-call ratio: A heavy put skew or elevated implied volatility on puts can indicate demand for downside protection from institutions; conversely, heavy call buying can signal optimism.
Recent reporting notes that derivatives signals around SOL suggest traders are finding support despite price softening — for example, steady ETF inflows accompanied by a derivatives base that limits extreme shorting pressure (The Currency Analytics). That dynamic creates a scenario where volatility compresses and range-bound trading becomes more likely until one of the forces — technical breakdown or flow exhaustion — decisively wins.
How to interpret the combined picture
- If you’re strictly technical: a death cross raises your threshold for long exposure. Wait for trend-confirmation signals — a reclaim of the 50-day MA, a rising 20/50 EMA crossover, or expanding volume on rallies — before adding size.
- If you prefer flow-driven positioning: ETF inflows and constructive derivatives positioning justify tactical long exposure on dips, ideally with hedges to protect against trend continuation lower.
- If you trade derivatives: use options to express asymmetric views — buy protection (puts) while collecting premium via covered calls or call spreads if you’re moderately bullish.
Risk-managed trade ideas
Below are concrete setups for both short and long views. Each assumes you size positions as a fraction of portfolio risk (e.g., 0.5–2% of capital at risk per trade) and use stop-losses and hedges.
Tactical short (momentum-following)
- Trigger: Failure to reclaim the 50-day MA on a clean, daily close with expanding volume; confirmation if open interest increases while price declines.
- Instrument: Short perpetual futures or enter a short futures position; alternatively, buy a bearish put spread in options to define risk.
- Stop: Above the 50-day MA (or the most recent swing high) plus a buffer of 1–1.5x ATR.
- Target: Initial target at recent support zone or 1–2x the risk distance; scale out as price approaches the 200-day MA or key horizontal supports.
- Risk management: Limit position size so the total capital at risk is within your trade budget. If using futures, monitor funding and liquidation risk; consider hedging some exposure by buying a small protective call if short-term squeezes are a concern.
When to avoid: If funding turns strongly positive and open interest rolls off (signalling long rebuilding), the short thesis weakens despite the death cross.
Tactical long (buy-the-dip with hedges)
- Trigger: Price tests a defined support area (e.g., measured multi-week demand zone) and shows bullish divergence on momentum indicators (RSI, MACD) or a decline in sell-side open interest. ETF inflows acting as a demand anchor strengthen this setup.
- Instrument: Ladder into spot or cash-buy orders to average in; buy put protection (long puts or a put spread) sized to limit downside risk.
- Stop: Below the support zone and the point where flows would likely dry up; alternatively, use a volatility-adjusted stop such as 1.5–2x ATR below entry.
- Target: Tactical targets near the 50-day MA for short-term trades, or the 200-day MA and higher for a multi-week recovery play. If you’re a longer-term allocator, size for averaging and expect drawdowns.
- Risk management: If you’re using options, sell covered calls or implement a collar to finance protection. For a pure directional long with ETF inflows, keep position sizing conservative until price structure confirms a higher low.
Structured derivatives play (asymmetric risk)
- Bullish asymmetric: Buy a cheap long-dated directional call or call spread while selling a nearer-term call to reduce cost. This leverages ETF-driven upside while capping premium paid.
- Defensive asymmetric: Buy a put spread and simultaneously sell a further out-of-the-money put to finance cost (a limited-risk, limited-reward hedge). Useful for portfolio managers who want exposure but limit short-term drawdowns.
- Relative-value: If funding rates diverge across exchanges, consider basis trades (long spot, short perpetual) to capture funding carry, but be mindful of counterparty and margin risks.
Positioning guidance for different mandates
- Active traders (short-term): Focus on derivatives and risk-defined option structures. Use daily/weekly timeframes and watch funding rates and open interest closely. Favor smaller, repeatable trades rather than large directional bets while the death cross bias persists.
- Tactical allocators (multi-week): Build on controlled dip-buying but hedge with puts or collars until the chart shows a reclaim of the 50-day MA or positive trend confirmation. Use ETF flow reports as a secondary validation for accumulation.
- Long-term portfolio managers: Treat short-term technicals as noise relative to fundamental allocation decisions. If Solana remains part of your long-term thesis, consider dollar-cost averaging through volatility and using ETFs as an on-ramp for large, tax-efficient accumulation.
Practical checklist before taking a trade
- Confirm the technical trigger (death cross vs. reclaim).
- Check the latest ETF flow cadence and AP/creation patterns — are inflows steady or drying up? (See TokenPost and The Currency Analytics).
- Read derivatives: funding rates, open interest, options skew.
- Define stop, target, and position size in dollars and percent risk.
- Decide on hedges (puts, collars, basis trades).
Final thoughts: trade the tension, don’t ignore it
The death cross on SOL raises a legitimate caution flag for traders, but steady institutional inflows via SOL ETFs and constructive derivatives signals complicate the picture. That ambiguity is an opportunity: it rewards traders and managers who combine technical analysis with flow and derivatives reads rather than relying on a single signal.
For active positioning, favor risk-defined, hedged trades and smaller sizes until trend confirmation arrives. For longer-term allocators, ETF inflows provide a mechanism to accumulate while managing drawdown with options or collars. Keep monitoring the key inputs — moving averages, funding, open interest, and ETF flows — and adjust bets when one narrative decisively overtakes the other.
For ongoing coverage and tactical ideas on altcoins and market structure, follow commentary around Solana and the broader DeFi landscape as flows and technicals evolve.