When Whales Turn: Why Solana Looks Vulnerable as Bearish Flows Mount
Summary
Quick take
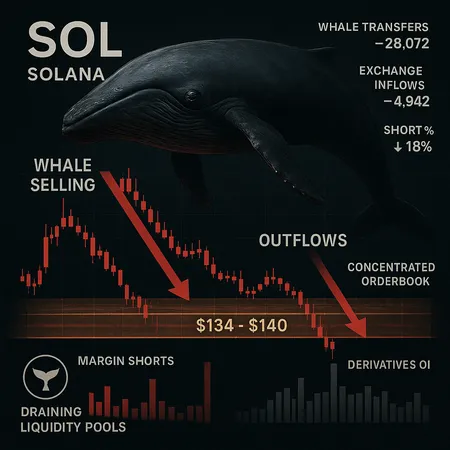
Solana has moved from a market leader in activity to one of the more fragile risk-assets in this correction. Over the past week institutional and retail risk-off has hit multiple chains, and SOL has shown outsized sensitivity as large holders (whales) flipped from accumulation to distribution. Several industry reports document that heavy selling and rising short pressure are already built into market dynamics, while technical analysis flags a critical support band at $134–$140. For active traders and on-chain analysts, the core question is whether this is a transient capitulation or the start of a deeper re-pricing driven by concentrated liquidity and derivatives risk.
Quantifying the whale flip: what the evidence shows
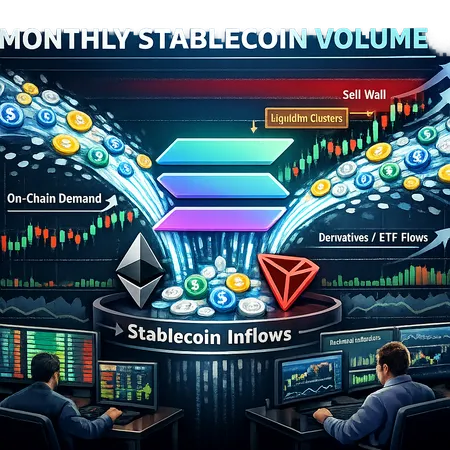
Monitoring headlines alone isn’t enough — the layering we care about is: whale transfers to exchanges, exchange inflows, sudden changes in on-chain concentration, and a spike in short-side open interest.
- Journalists and trackers noted a clear behavioral shift: AmbCrypto documented that Solana whales have begun heavy selling and that the narrative has flipped bearish, increasing short pressure in futures markets. See their coverage for specifics on large wallet flows and market reaction AmbCrypto analysis.
- Macro market flow amplified the move: a market summary documented that ETH, XRP, ADA and SOL fell between 8%–16% in a single week, underscoring that SOL’s drop is part systemic and part idiosyncratic (CoinDesk).
- Technical trackers pointed to a short-term price breakdown into the $140 area and modeled a probable slide toward $134 if selling continues (CoinPedia technical piece).
Taken together: on-chain flow reporters see large transfers and exchange inflows; derivatives desks report elevated short-side bets. That confluence — big holders selling while shorts add — creates a self-reinforcing path for price weakness.
Mapping on-chain metrics to the $134–$140 support zone
On-chain indicators give us actionable context for the technical support band.
- Exchange inflows: persistent net inflows to centralized exchanges typically precede price pressure because they increase liquidity available for spot selling. When large SOL transfers land on exchanges, watch whether they come from known whale wallets or staking custodians.
- Concentration of supply: Solana’s supply is more top-heavy than many altcoins; when the top percentile of holders reduce balances, realized liquidity evaporates and orderbook depth thins, making levels like $140 more brittle.
- DEX liquidity and slippage: several major AMM pools on Solana can provide deep on-chain liquidity, but they’re often concentrated in a handful of pools. Big sells against these pools cause outsized price impact; if AMM TVL drops alongside whale selling, the market can gap through the $134–$140 band quickly.
Charting the path: if exchange inflows spike while open interest on futures rises and AMM TVL declines, the price is likely to test $140; a failure to hold that level increases the probability of a drop to around $134, which technical analysts flagged as the next structural support.
Liquidity profile and derivatives positioning — does Solana have unique exposure?
Yes — relative to larger, more widely held coins, SOL shows structural vulnerabilities driven by liquidity concentration and where its derivatives are traded.
Orderbook concentration and market depth
Centralized orderbooks for SOL are thinner on some venues compared with BTC or ETH, and liquidity is sometimes fragmented across exchanges and DEXs. That fragmentation means a single large sell or a coordinated whale exit can push through multiple price tiers rather than being absorbed incrementally.
Derivatives footprint and leverage
Derivatives positioning matters. If a sizeable chunk of short/long exposure sits on a limited set of platforms, funding-rate mechanics and auto-deleveraging systems can amplify moves. AmbCrypto’s reporting on increasing short pressure underscores how a concentrated short build can make the instrument unstable: funding divergences and liquidations cascade.
Collateral and staking liquidity
A material share of SOL supply is staked. While staking reduces circulating float, it can also create sudden liquidity shifts: when validators or large delegators choose to unstake or reallocate via exchanges or OTC desks, the perceived ‘locked’ supply can turn available quickly, stressing spot markets.
In short: Solana’s network-level liquidity (AMMs + concentrated CEX orderbooks) and derivatives concentration increase its tail risk versus larger-cap peers.
Practical signals traders should watch (and thresholds to act)
Below are concrete on-chain and derivatives signals that should guide intraday trading, hedging, and position-sizing.
- Whale flow (high-priority): Large, single-wallet transfers to exchanges. A cluster of >3 transfers from wallets historically labeled as "whales" to centralized exchanges within 24–48 hours is a red flag.
- Exchange net inflows vs outflows: Persistent net inflows over 24–72 hours, especially when coupled with rising short open interest, suggests increased downward pressure.
- Funding rates and open interest: Rising negative funding rates while open interest grows indicates shorts are adding. If funding flips deep negative and OI spikes, expect violent rebounds or rapid downside if longs get squeezed.
- Concentrated orderbooks: Low depth within 1–3% of mid-price on a primary exchange — measure by cumulative volume to move price 2% — points to fragile support. If depth is thin around $140, the band will likely fail under whale selling.
- AMM TVL and concentrated LP withdrawals: Rapid decline in TVL in Solana AMMs correlates with higher slippage on on-chain sells.
- Liquidation clusters: A sequence of liquidations in futures markets often precedes momentum moves; set alerts for clustered automatic liquidations above a certain size.
How to act on signals:
- If whale inflows + negative funding + rising OI occurs: tighten stops, consider short hedges or buying puts if available. Platforms like Bitlet.app can be used to execute hedges quickly, but position sizing is key.
- If inflows reverse and large wallets shift holdings off-exchange: consider re-entering gradually; watch for restored AMM depth and positive funding.
Network usage implications: activity vs price feedback loop
Solana’s value story rests partly on high-throughput activity (DeFi, NFT minting, fast payments). That utility can either cushion or amplify sell-offs:
- If network usage drops (lower DEX volumes, fewer NFT mints), on-chain fee revenue and active user metrics decline — the narrative turns negative and can justify lower valuations. See how shifts in DeFi liquidity flow affect token sentiment.
- Conversely, if activity remains robust while whales sell, short-term price weakness can be transient; merchants and DEX liquidity providers might step in if volumes stay high.
- A sustained drop in on-chain activity reduces natural liquidity provision, making large orders more price-damaging and deepening the drawdown.
A concise trader checklist
Use these bullets as a quick decision framework when trading or hedging SOL:
- Check whale transfers to exchanges (alerts for >3 large transfers in 48h).
- Monitor exchange net inflows for persistent 24–72h trends.
- Watch funding rates and open interest — negative funding + rising OI = elevated short risk.
- Measure orderbook depth within ±2% of mid — if shallow, reduce size or use limit orders.
- Monitor AMM TVL and concentrated LP withdrawals on major Solana DEXes.
- Align technical levels with on-chain signals: if $140 breaks on confluence of the above, target downside to $134 with tight risk controls.
Also keep an eye on macro cross-asset moves: broad crypto risk-off increases the odds of a deeper SOL correction. For context, the recent weekly drawdown across several assets shows SOL is not isolated in this move (CoinDesk market summary).
Final view: tradeable thesis and risk management
Solana’s current vulnerability stems from three overlapping factors: a clear behavioral flip among large holders toward selling and shorting, technical fragility around $134–$140, and a liquidity/derivatives profile that magnifies price impact. That combination makes SOL more likely to experience sharp, waterfall-like moves compared with deeper markets.
For active traders and on-chain analysts:
- Short-term traders should rely on a mixture of on-chain flow alerts and orderbook depth rather than pure chart levels. Use derivatives to hedge sized exposures and respect stop-loss discipline.
- Longer-term holders should monitor whether on-chain activity (DEX volumes, NFT/application usage) re-accelerates; persistent declines in network usage warrant re-evaluating thesis.
This is not a prediction that SOL will inevitably fall to $134 — but it is a warning: if whale selling and concentrated shorts continue to converge, the path to that next support becomes materially more probable. Stay nimble, size positions to handle sudden liquidity evaporation, and use the signals above to time entries or hedges.