XRP’s Disconnect: Why Big Spot‑ETF Flows and Goldman Stakes Haven’t Moved the Price
Summary
Executive overview
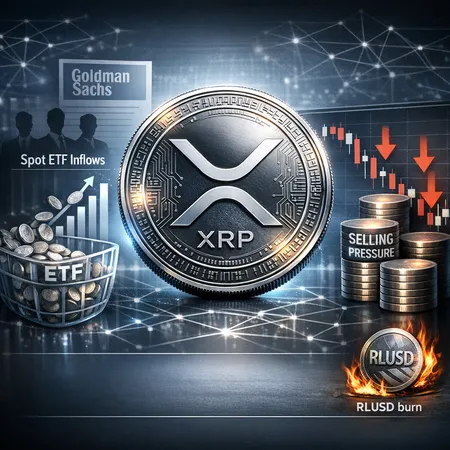
Institutional capital is arriving in XRP via spot‑ETF channels and disclosed holdings, yet the price has largely refused to cooperate. Headlines about $1.4 billion in spot‑ETF inflows and major firms like Goldman Sachs showing large ETF exposure should have been bullish. Instead, traders see muted price action and persistent selling pressure.
This piece parses the data, links on‑chain activity to market structure, assesses Ripple’s corporate moves (AFSL licensing push, executive signals, and an unprecedented RLUSD burn), and gives a framework for deciding whether current weakness is an entry point or a sign of deeper structural resistance. For many investors the choice is about appetite for operational and regulatory risk versus time‑horizon conviction—Bitlet.app investors will recognize the same signals used on trading platforms and allocation dashboards.
The headlines: institutional flows and disclosed stakes
In recent coverage Coinpaper highlighted roughly $1.4 billion in reported spot‑ETF inflows tied to XRP, a number that reflects concentrated interest from ETF buyers and authorized participants trying to source underlying supply Coinpaper coverage. Separately, reporting shows large institutional ETF exposure such as Goldman Sachs holding more than $150 million in XRP ETF positions, a disclosure that signals material institutional participation rather than retail speculation alone BeInCrypto report.
Those facts together ought to be constructive: ETFs buy the underlying (or create synthetic exposure), demand should lift price, and disclosed large holdings are a stamp of institutional comfort. But they are only part of the story.
On‑chain activity vs. price: lots of motion, little locomotion
A further wrinkle is the XRP Ledger itself. Recent data shows very high transaction volumes—millions of ledger transactions—without corresponding price momentum, implying that a lot of chain activity is not speculative accumulation but transactional flow, internal redistribution, or programmatic movement crypto.news on ledger transactions.
High throughput can mask who is actually buying or selling. Institutional ETF buys often occur off‑exchange via authorized participants, and large transfers between wallets can be internal (custody reshuffles) or purposeful distribution by whales. The ledger’s activity alone doesn’t prove end‑user demand for long‑term holdings.
Why price can remain muted despite rising institutional demand
1) Distribution and whale behavior
One common outcome when institutions enter a market is that existing large holders (whales, early investors, or insiders) use the liquidity window to sell into demand. If whales anticipate higher demand from ETFs—and they often do—they can distribute inventories into the flow, absorbing buying pressure and capping price.
This is not conspiratorial; it’s basic market microstructure. If inflows are meaningful but are matched by sell orders from large holders, net price pressure can be zero or even negative.
2) Spot‑ETF mechanics and the authorized participant (AP) model
Spot ETFs do not magically remove tokens from circulation unless ETF issuers take custody and lock them in fund treasuries. The creation/redemption process is mediated by authorized participants who may source supply on exchanges, OTC desks, or from custodians. That process can be neutral or even destabilizing:
- APs arbitrage ETF NAV vs. market price by buying/selling the underlying; that can compress premiums but not necessarily push prices higher if selling pressure exists elsewhere.
- Institutions often prefer ETF exposure precisely because it avoids moving large amounts on‑chain; ETFs can produce large notional exposures with minimal public token flows.
So ETF inflows can represent demand in notional terms while leaving visible price drivers muted.
3) Passive accumulation and lock‑up asymmetry
Some institutional accumulation strategies are passive and incremental. If institutions buy slowly over weeks/months to avoid market impact, price response is gradual. Conversely, sellers who wish to exit quickly can dump into any available bid, producing asymmetric pressure.
4) Supply effects and RLUSD dynamics
Ripple’s corporate actions matter. The company’s recent record RLUSD burn—reported as a 10,000,000‑coin reduction—reduces circulating supply of that particular stablecoin and signals an intent to manage supply dynamics u.today on RLUSD burn. However, RLUSD supply is a small slice relative to total XRP liquidity; burns are meaningful for signaling but not necessarily enough to drive price by themselves.
Moreover, broader supply comes from exchange inventories, institutional wallets, and legacy distributions. Unless burns and lockups materially reduce the free float available to traders, price impact can be limited.
5) High on‑chain throughput that isn’t speculative demand
As noted, XRP Ledger transaction counts have climbed, but many transfers are payments, routing, custody shuffles, or programmatic movements rather than accumulation. High on‑chain volume is not the same as buy pressure unless it results in tokens moving off exchanges into long‑term cold storage.
Ripple’s corporate narrative: AFSL push, CEO signals, and why they matter (but don’t guarantee price)
Ripple has been active beyond the markets. Pursuing an Australian Financial Services Licence (AFSL) is an explicit attempt to scale institutional payments and custody operations across APAC—this strengthens the commercial case for XRP as a settlement rail and institutional product ZyCrypto on AFSL push.
Combined with CEO guidance about strategic priorities and the RLUSD burn, these moves improve the long‑term fundamentals: better regulatory footprints, clearer product offerings, and tokenomics management. But fundamentals and price can diverge for months or years while market structure, liquidity distribution, and macro risk appetite play out.
For example, a successful AFSL will likely increase institutional flows over time—through payments and custody demand—but it won’t immediately constrain spot supply held by private wallets or exchanges.
Reading the signals: indicators institutional and sophisticated retail investors should watch
Below is a practical framework—what to watch and why—when assessing whether current weakness in XRP is a buying opportunity or a structural headwind.
Market‑structure signals (short‑ to medium‑term)
- ETF inflows trend: look at weekly/monthly net flows and whether inflows are accelerating or plateauing. Sustained inflows matter more than headline spikes. See the Coinpaper coverage for context on inflow magnitudes.
- Authorized Participant (AP) creation/redemption data: increasing creations with tokens moving into fund custody reduce floating supply; redemptions are the opposite. Where available, these are direct evidence of ETF demand impact.
- Exchange net flows: large net outflows to custody wallets (cold storage) are bullish; inflows to exchanges suggest potential selling pressure.
- Whale distributions: monitor top wallet transfers to exchanges or OTC counterparties—this is where selling pressure often originates.
On‑chain and network health (medium‑term)
- XRP Ledger active addresses and unique recipients: sustained growth in unique address activity suggests genuine usage rather than circular transfers.
- Token movement classification: are transfers to custodial providers versus exchange hot wallets? Custodial inflows that result in cold storage are more bullish than hot wallet inflows.
- RLUSD supply changes: burns like the recent 10M reduction are positive but quantify them against total supply to assess real impact.
Macro and institutional context (medium‑ to long‑term)
- Regulatory posture and licensing wins (e.g., AFSL): these increase institutional confidence and can change demand composition from speculative to utility‑driven.
- Large institutional holdings disclosures: sustained holdings by reputable institutions reduce counterparty and custody concerns, but they can also be sold.
- Market liquidity depth: look at order book depth across major venues—shallow markets amplify selling pressure.
Sentiment and derivatives (short‑term volatility cues)
- Options skew and futures funding rates: negative skew and persistent short funding suggest directional bearishness.
- Open interest concentration: rising OI with price stagnation can precede large moves when positioning changes.
Practical decision tree: buy, watch, or avoid?
Buy (if): you have a long horizon (12+ months), the AFSL/regulatory path and product adoption continue, ETF inflows persist, and on‑chain metrics show net withdrawals from exchanges. In that case, use staged position building (DCA) and size positions to tolerate interim volatility.
Watch (if): ETF inflows are present but exchange inventories are stable or rising, top‑wallet distributions are frequent, and AP creation data is mixed. Consider allocating a small starter position and watch for confirmation—meaning consistent exchange outflows and sustained AP creations into fund custody.
Avoid / Reduce (if): large, sustained exchange inflows, repeated whale dumps, or abrupt regulatory setbacks occur. Also, if derivatives positioning shows a steady build of short exposure with no reduction on positive news, the structural headwind is meaningful.
Example trade plan and risk management
- Entry: scale in over 4–8 weeks, e.g., 25% initial tranche, add 25% on confirmation (exchange outflows + positive AP creation), remainder on sustained inflows and network growth.
- Stops: avoid tight percentage stops in volatile environments; instead use a structural stop (e.g., significant breach of support levels combined with worsening on‑chain supply metrics).
- Size: cap allocation to a portion of liquid portfolio (institutional: single‑digit percentage unless thesis is firm; retail: smaller). Use portfolio risk budgets—not price targets alone.
What to expect next (probabilities, not certainties)
- Scenario A (probable short term): Continued sideways price action with episodic spikes when ETF flows accelerate or when whales pause distribution. On‑chain throughput stays high.
- Scenario B (conditional medium term): If AFSL wins and ETF inflows persist while exchange inventories decline, price could re‑rate as float becomes constrained and real demand materializes.
- Scenario C (adverse): Increased selling by large holders and lack of custody inflows into funds could prolong or deepen the consolidation.
Final takeaways
- Institutional signals—$1.4B of reported spot‑ETF inflows and disclosures like Goldman Sachs’ exposure—are meaningful but not sufficient alone to guarantee immediate price upside. See the reporting from Coinpaper and BeInCrypto for data points.
- Price is a function of net demand vs. net supply. If institutional demand is offset by distribution from whales or supply remains high on exchanges, price can stay muted.
- Ripple’s corporate moves (AFSL pursuit, CEO guidance, and RLUSD burns) strengthen the long‑term fundamental case, but they do not automatically remove short‑term liquidity or distribution dynamics.
- Investors should use a data‑driven framework: monitor ETF flow persistence, AP creation/redemption data, exchange net flows, whale movements, and on‑chain indicators. That combination will tell you whether current weakness is a buying opportunity or a structural headwind.
If you want a template to track these metrics weekly (ETF flows, exchange net flows, top‑wallet transfers, AP creations), I can draft one tailored for institutional or sophisticated retail portfolios.
Sources
- Coinpaper coverage of spot‑ETF inflows: https://coinpaper.com/15336/xrp-on-fire-1-4-b-in-spot-etf-shows-institutional-stampede?utm_source=snapi
- BeInCrypto: Goldman Sachs’ reported XRP ETF exposure: https://beincrypto.com/xrp-price-goldman-sachs-etf-bearish-analysis/
- Crypto.news on XRP Ledger transaction activity: https://crypto.news/xrp-price-stuck-despite-2m-ledger-transactions/
- ZyCrypto on Ripple’s AFSL push: https://zycrypto.com/xrp-steadies-as-ripple-seeks-australian-license-to-scale-payments-across-apac/
- U.Today on Ripple’s record RLUSD burn: https://u.today/ripple-labs-conducts-largest-rlusd-burn-ever-10000000-coins?utm_source=snapi