Meme‑Coin Dynamics: A Practical Guide Using Shiba Inu’s Burn‑Driven Rally
Summary
Why memo‑coins behave like they do — a quick framing
Meme coins such as SHIB and DOGE are liquidity‑driven, sentiment‑sensitive assets. The price action you see isn’t just supply and demand in the textbook sense — it’s a layered feedback loop: social signals (tweets, TikTok, Reddit) change trader expectations, which drives order flow; that order flow alters on‑chain metrics (exchange balances, transfer volumes, burned tokens), which in turn feeds sentiment again. Add a large macro event — say a Bitcoin rally or ETF rebalancing — and capital often rotates into higher‑beta instruments, magnifying moves.
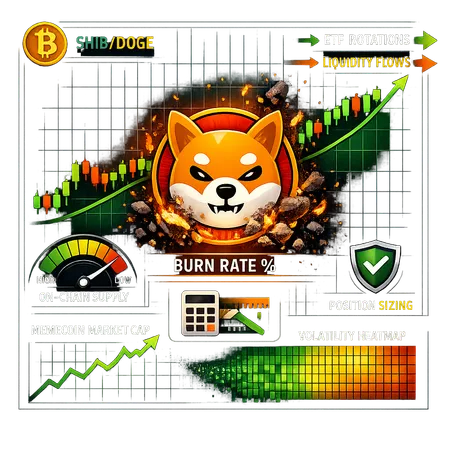
The recent Shiba Inu rally was a classic example: a sharp increase in token burns coincided with a broader memecoin market‑cap expansion as BTC strengthened, producing outsized short‑term returns. But correlation is not causation — and that distinction is crucial for traders.
Token burns and why they matter (but not always)
How token burns change the math
A token burn is a deliberate removal of tokens from circulation, typically by sending them to an irrecoverable address. At a basic level, burns reduce circulating supply, so if demand stays constant or rises, price should, all else equal, increase because each remaining token represents a larger share of the network’s economic value.
However, two caveats matter practically:
- Scale relative to supply: For tokens with enormous total supply (like SHIB historically), millions or even billions burned might be a tiny percentage of circulating supply. The price impact depends on the percentage change, not the absolute number.
- Velocity and recycled supply: Burned tokens can be offset by minting, liquidity provider rewards, or concentrated holder selling. A one‑day spike in burns doesn’t guarantee a sustained squeeze unless burns change supply dynamics meaningfully over weeks or months.
The recent Shiba Inu event illustrates both sides. Blockonomi reported that burn activity exploded — a multi‑hundred percent increase in burn rate — which coincided with an 8%+ rally in SHIB. That spike in burns increased narrative momentum and reduced token float on the margin, but traders should ask: is that burn persistent, and is it large relative to the effective circulating supply? See the Blockonomi piece for the reported burn surge: Blockonomi: Shiba Inu surge and burn rate.
On‑chain supply changes vs price: the timing problem
Supply contraction is bullish only if demand is steady or rising. Timing matters:
- If burns are one‑off marketing events, they can trigger short squeezes and retail FOMO but fail to sustain price when buys stop.
- If burns are structural (continuous mechanism, protocol fee burns, or community‑driven long‑term burns), they can alter tokenomics meaningfully.
A good rule of thumb: look for sustained decreases in exchange balances combined with repeated burns and an expanding holder base. That combination reduces immediate sell pressure and increases the odds a rally can hold.
Macro and rotation drivers: BTC, ETFs, and liquidity flows
Meme coins rarely move alone. When Bitcoin runs — and liquidity arrives because of ETF inflows or macro headlines — traders often move into higher‑beta assets. Benzinga’s reporting that meme coin market caps rose alongside BTC strength when Bitcoin hovered near new highs is a concrete example of this dynamic: hot money rotates to chase outsized returns, lifting SHIB, DOGE, and other speculative tokens together. See the Benzinga piece for coverage of these co‑moves: Benzinga: Meme coin moves amid BTC rally.
ETF windows, futures expiries, and macro re‑risking are predictable liquidity events. Experienced traders monitor them closely because memecoins amplify rotational flows. If an ETF inflow into Bitcoin is driving spot price up, that creates both the push (more capital) and the pull (higher risk appetite) that can lift memecoins.
Case study: SHIB’s recent burn‑driven rally — reading the setup
In the latest SHIB move, a big uptick in burns coincided with a break above a resistance area that some analysts flagged as key. Coverage at U.Today discussed whether SHIB “silently” breached its biggest resistance of the year — a technical confirmation that reinforced the on‑chain narrative and accelerated buying momentum. Read that analysis here: U.Today: Did SHIB break its key resistance?.
The sequence to watch in real time for an event like this is:
- Pre‑event accumulation: whales or bots buy into liquidity pools, sometimes quietly. Watch for decreases in exchange balances.
- Catalytic burn or news: the burn spike and news stories provide a narrative that retail amplifies.
- Break of technical resistance: price action validates the narrative; momentum traders pile in.
- Liquidity rotation: BTC or ETF flows bring fresh capital, increasing depth on bids.
- Reversion or continuation: without sustained on‑chain support (continued burns, holder growth), the move may collapse when momentum traders exit.
Traders who spotted the early combination of persistent burns + exchange outflows + a structural breakout captured gains — but only if they managed risk around the inevitable volatility.
Practical trading setups for meme‑coins (short‑term and swing)
Short‑term setups (scalp & momentum)
- Entry trigger: momentum confirmation on 1–15m charts (e.g., high volume breakout candle above local resistance, paired with a spike in on‑chain buys or reduced exchange balances).
- Stop placement: use recent low or a volatility‑based stop (1–2x ATR on short timeframes). Given extreme volatility, expect large whipsaws.
- Target: scale out into strength (e.g., take 25–50% off at first resistance, tighten rest to breakeven).
- Tools: use orderbook depth, DEX liquidity pool size, and whale trades to confirm that your stake can be exited without crippling slippage.
Swing setups (multi‑day to weeks)
- Entry trigger: confirmed technical breakout on higher timeframe (4h/day) plus supporting on‑chain signals (ongoing burns or falling exchange balances, rising unique holders).
- Stop placement: below the breakout level or a percentage of capital consistent with your risk budget (see position sizing below).
- Management: monitor burn rate persistence and exchange flows daily. If burns decline materially or exchange balances rise, consider trimming.
Position sizing and risk rules for high volatility tokens
Meme coins can move 20–50% in a day. That requires position sizing discipline. A practical framework:
- Set a maximum risk per trade in USD terms (trader example: 1% of account equity). For a $100,000 account, that’s $1,000 at risk.
- Determine stop distance (in USD or percent). If your stop is 20% away, then position size = risk amount / stop distance. Example: $1,000 / 0.20 = $5,000 position.
- Cap exposure by token and by strategy. Reasonable limits for many funds/traders are: max 1–2% of NAV in a single meme token and 5–10% total exposure across all meme tokens.
- Avoid excessive leverage. Meme coins’ volatility blows up margin instantly.
Example calculation:
- Account: $50,000
- Risk per trade: 1% = $500
- Planned stop: 25% below entry
- Position size = $500 / 0.25 = $2,000 notional
If you want to be more conservative, lower the max risk to 0.25–0.5% for ultra‑high volatility names.
For funds, add stress‑tested scenarios: simulate 40–60% drawdown windows and set maximum VaR limits and mandatory hedges (options or inverse positions) if memecoin exposure exceeds thresholds.
Tools & on‑chain metrics to separate traps from sustainable moves
Key on‑chain and off‑chain signals to monitor:
- Burn rate (daily/weekly): Is the burn a one‑day spike or a sustained trend? Persistent burns carry more weight.
- Exchange balance trends: falling exchange balances usually mean less immediate sell pressure.
- Holder distribution: increasing count of small holders and declining concentration among top 10 wallets reduces centralized sell risk.
- Token age and active supply: rising active supply (older tokens being moved) can signal profit taking.
- Liquidity pool depth and rug flags: low LP depth and single‑address LP control are red flags.
- Large transfers to exchanges: these often precede sell pressure.
- Social engagement vs. on‑chain fundamentals: sudden spikes in social metrics without on‑chain backing often precede fades.
Useful tools: Etherscan for transfers and burns, Dune/Nansen for dashboards on holders and wallet intelligence, DexTools for orderbook/LP depth tracking, and WhaleAlert or similar for large transfers. For quick narrative context, combine these with market coverage — the Blockonomi and Benzinga pieces are examples of how reporting amplifies narratives around burns and BTC correlations.
Red flags and trap detection
- One‑day burn spikes with no reduction in exchange balances: likely marketing or temporary.
- Concentrated burns by a single wallet followed by transfers to exchanges: suspicious.
- Liquidity removal: creators pulling LP tokens or locking expiring can precipitate crashes.
- Social pump without on‑chain volume or holder growth.
If you see multiple red flags, stay out or use tight sizing and fast exits.
Practical risk management playbook (checklist)
- Pre‑trade: confirm at least two supporting signals (e.g., burn trend + falling exchange balances, or technical breakout + whale buys).
- Risk sizing: cap per‑trade risk (0.25–1% for retail traders; stricter for funds). Never risk more than your rule allows.
- Execution: stagger entries using limit orders to minimize slippage on low‑depth pairs.
- Stop & manage: use volatility‑adjusted stops and move stops to breakeven after a pre‑defined move.
- Post‑trade: log trade rationale, outcome, and on‑chain signals to refine pattern recognition.
Many traders and community managers use platforms such as Bitlet.app to break large buys into tranches and manage P2P fills; operational execution matters as much as strategy in thin markets.
Final considerations: narrative vs fundamentals
Meme‑coin rallies are frequently narrative driven and can produce rapid profits — but they also carry outsized tail risk. Burns can be a powerful narrative accelerator, especially when reported widely and paired with macro liquidity rotations. The key is to distinguish cosmetic burns and one‑off marketing from persistent tokenomic changes that meaningfully reduce float.
If you trade these markets, combine on‑chain conviction (burn persistence, falling exchange balances, holder base growth) with classic risk control (small position sizes, stress testing, and tight execution). The trades worth taking are those where both supply dynamics and demand signals align — not merely where the Twitter narrative is loudest.
Sources
- Blockonomi — Shiba Inu surge and burn rate report: https://blockonomi.com/shiba-inu-shib-surges-8-as-burn-rate-explodes-637-higher/
- Benzinga — Coverage of meme coin market‑cap moves alongside BTC strength: https://www.benzinga.com/crypto/cryptocurrency/26/03/51427535/bitcoin-at-71000-ethereum-xrp-dogecoin-gain-1?utm_source=benzinga_taxonomy&utm_medium=rss_feed_free&utm_content=taxonomy_rss&utm_campaign=channel&utm_source=snapi
- U.Today — Analysis on SHIB breaking resistance: https://u.today/did-shiba-inu-silently-break-biggest-resistance-of-this-year?utm_source=snapi