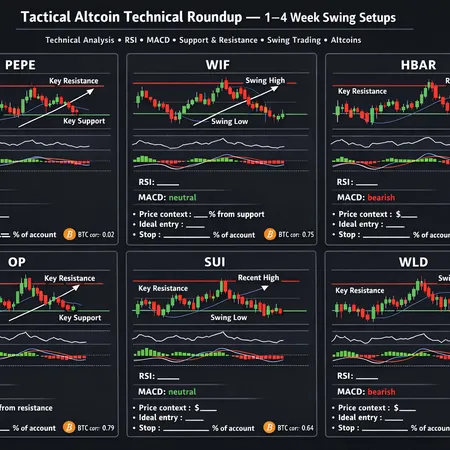
Altcoin Technical Roundup: Tactical RSI/MACD Setups for PEPE, WIF, HBAR, OP, SUI, WLD
Summary
Quick market context and how to use these setups
Altcoins remain sensitive to chop in Bitcoin and to flows rotating between memecoins, layer-1s and layer-2 tokens. Use these tactical setups to identify asymmetric swing opportunities over the next 1–4 weeks: entries that lean on RSI and MACD confirmations, stops under structure, and position sizes tied to a fixed portfolio risk (commonly 1% or 2%). For broader market correlation, remember that many smaller caps will spike or retrace aggressively if Bitcoin breaks a major level — keep that macro filter on.
Each token profile below includes: current price context (from the March 22 technical notes), key support/resistance, RSI/MACD read, an explicit trade setup (entry, trigger, target), stop placement, position-sizing rule, and a one-week to one-month roadmap.
How to size and place stops (reusable rule)
- Risk per trade: default 1% of portfolio; aggressive traders may use 2% but reduce the number of concurrent positions.
- Position size formula: Position Size = (Portfolio Value * Risk %) / |Entry − Stop|.
- Stop placement standard: under the nearest structural support for longs, or above the nearest structural resistance for shorts. For fast altcoins consider a volatility buffer (e.g., 1–2 ATR or 3–6% depending on token) to avoid noise stops.
- Use partial profit-taking: take 50% at the first objective and move stop to breakeven; let the rest run with a trailing stop.
PEPE — technical correction scenario
Current context & levels
Analysts flagged PEPE for a technical correction with bearish momentum in short-term oscillators (RSI and MACD), suggesting downside pressure could test nearby structure. Treat the token as high-volatility, momentum-driven — tradeable only with tight risk controls.
Indicators
- RSI: short-term RSI is showing momentum loss (bearish divergence in some timeframes), indicating sellers have the edge.
- MACD: recent MACD histogram and signal dynamics point to weakening bullish impulse or an active bearish cross.
Trade setup (short-term swing)
- Setup idea: look for a confirmed bounce off a defined support zone (use the most recent multi-day swing low) with RSI recovering above ~40 and a bullish MACD histogram contraction as the entry confirmation. Alternatively, if MACD confirms the bearish cross and price breaks below support, consider a measured short with tight risk.
- Entry trigger (long): bullish RSI recovery + MACD histogram rising for two consecutive candles after a clear support hold.
- Targets: first target at the 20–50 EMA cluster or immediate swing high; second target at the prior consolidation top.
Risk, stops & sizing
- Stop: place under the confirmed multi-day support (add a small volatility buffer ~2–4%). If shorting, stop above the local resistance or EMA cluster.
- Position sizing: risk 1% of portfolio per trade. If the distance from entry to stop is large (>6–8%), reduce capital allocated or use a smaller risk percent.
BTC correlation & roadmap (1 week → 1 month)
- Correlation: PEPE is highly beta to speculative sentiment and will amplify BTC moves. A decisive BTC breakdown typically invalidates bullish PEPE setups.
- 1-week: expect continued volatility — watch for clear RSI/MACD confirmations before adding; avoid averaging into a trendless bleed.
- 1-month: if indicators recover and volume returns, the token can retest previous swing highs; otherwise, plan to re-evaluate after consolidation or a macro BTC improvement.
(Given the pronounced short-term bearish signals highlighted in the March 22 note, prefer confirmation over blind punts.) PEPE technical note
WIF (DogWifHat) — bounce play with clear breakout targets
Current context & levels
Technical commentary points to a bounce thesis with clear support and resistance mapped — traders are eyeing a potential breakout toward ~0.21 if momentum resumes. The token has established a base that can be used for defined risk trades.
Indicators
- RSI: showing potential for a recovery bounce from oversold or neutral territory.
- MACD: looking for a bullish cross or histogram expansion to validate momentum.
Trade setup (defined-risk entry)
- Entry trigger: a daily close above the short-term resistance band or a retest-and-hold of the base with RSI >45 and MACD improving. Aggressive entries can use intraday pullbacks to the breakout level.
- Targets: primary target near 0.21 (per the technical outlook); secondary target at the next historical resistance zone or measured-move projection from the base.
Risk, stops & sizing
- Stop: under the base/support; if you enter a breakout long, use a stop under the breakout candle (or under the base low) with a volatility buffer.
- Position sizing: keep risk to 1% of portfolio. Because WIF can gap, use smaller absolute exposure if the stop distance is wide.
BTC correlation & roadmap
- Correlation: WIF behaves like most small caps — positive beta to risk appetite and BTC strength, but it can also move independently on token-specific flows.
- 1-week: test the breakout; avoid conviction trades until MACD confirms momentum.
- 1-month: if 0.21 is taken with conviction and volume, the next leg is credible; if breakout fails, expect a retest of the base and consider reducing size.
(See the WIF technical outlook for the breakout thesis and mapped levels.) WIF technical outlook
HBAR — oversold setup eyeing $0.10 resistance
Current context & levels
HBAR's technical profile has been tagged as oversold on short-term oscillators, with a key resistance cluster near $0.10 acting as the immediate upside hurdle. The oversold condition often provides a mean-reversion trade if buyers step in.
Indicators
- RSI: showing oversold readings which historically precede short corrective rallies.
- MACD: histogram is compressed and may be setting up for an early bullish crossover if momentum returns.
Trade setup (mean-reversion)
- Entry trigger: a clear bullish divergence on RSI or a MACD signal line cross on a daily/4H timeframe while price holds a near-term structural support.
- Targets: first target at $0.10 (the noted resistance), second target at the next supply cluster above.
Risk, stops & sizing
- Stop: place below the recent swing low, with a 3–5% buffer depending on HBAR volatility.
- Position sizing: risk 1% of portfolio; if stop distance is tight (2–3%), you can slightly increase allocation but remain conservative for correlation risk.
BTC correlation & roadmap
- Correlation: HBAR, as a mid-cap L1 asset, will correlate moderately with BTC but also reacts to network-specific news.
- 1-week: watch for a short squeeze or oversold bounce that takes price toward $0.10.
- 1-month: if impulse continues and MACD confirms, a sustained recovery to $0.10+ becomes credible; otherwise, wait for cleaner structure.
(Technical note flagged $0.10 as a key recovery level and highlighted the oversold setup.) HBAR technical note
OP (Optimism) — oversold bias with $0.13 breakout potential
Current context & levels
Optimism is showing oversold RSI readings in short-term charts, and analysts are watching $0.13 as a potential breakout target if momentum reverses. OP is a layer-2 with higher liquidity than many small caps, but it still reacts sharply to market-wide flows.
Indicators
- RSI: oversold — signaling opportunity for a mean-reversion play if buyers return.
- MACD: a potential early bullish cross would validate a swing entry.
Trade setup (conservative swing)
- Entry trigger: wait for RSI to stabilize and for MACD to show a bullish cross, or buy a retest of a breakout above immediate resistance with volume support.
- Targets: first target around $0.13; trail remainder above that level if momentum remains.
Risk, stops & sizing
- Stop: under the most recent structural low (plus a small buffer). For breakouts, use stop under the breakout candle.
- Position sizing: risk 1% per trade; reduce size if stop distance becomes >5%.
BTC correlation & roadmap
- Correlation: OP will correlate with macro risk sentiment and with Ethereum/Bitcoin moves since L2 activity links to ETH liquidity.
- 1-week: expect volatile chop; look for a clean MACD cross before committing.
- 1-month: if $0.13 is cleared with conviction and rising on volume, you can scale into a larger position; if it fails, cut loss and re-evaluate.
(For short-term technical commentary on OP’s oversold conditions and the $0.13 mark, see the linked note.) OP technical bias
SUI — consolidation with a $1.05 breakout target
Current context & levels
SUI has consolidated into a definable range and is being watched for a breakout toward approximately $1.05. Consolidations that compress volatility can produce clean swing trades when momentum resumes.
Indicators
- RSI: neutral to slightly oversold within the range; look for a rising RSI to confirm an upside breakout.
- MACD: a bullish cross on a higher timeframe (4H–daily) will be a higher-probability trigger.
Trade setup (range breakout or range-fade)
- Breakout entry: buy a daily close above the range with RSI trending up and MACD confirming; target $1.05 as the primary objective.
- Fade entry: short local strength up near range resistance if RSI is overbought and MACD shows divergence — only for experienced traders.
Risk, stops & sizing
- Stop (breakout): under the breakout candle or under the mid-range support; if fading, stop above the range with a volatility buffer.
- Position sizing: keep risk per trade to 1% of portfolio; because SUI can be liquidity-sensitive, avoid oversized positions.
BTC correlation & roadmap
- Correlation: SUI’s price action is partly token-specific but will suffer during systemic BTC/Ethereum sell-offs.
- 1-week: watch for a directional breakout on volume; if it fails, respect the range and wait.
- 1-month: a successful breakout to $1.05 on rising volume and improving MACD legitimizes a longer swing; otherwise, look for a lower-risk re-entry after consolidation.
(See technical projection for SUI’s breakout target.) SUI technical note
WLD (Worldcoin) — oversold bounce potential to $0.34
Current context & levels
Worldcoin is flagged as technically oversold and could see a recovery toward roughly $0.34 if buyers return. It behaves like a speculative small-cap that can produce sharp mean-reversion moves.
Indicators
- RSI: oversold, often signaling a lower-risk mean-reversion candidate.
- MACD: histogram compression suggests an incoming momentum shift if buyers re-enter.
Trade setup (mean-reversion)
- Entry trigger: look for bullish divergence on RSI or a MACD cross on the 4H/daily chart while price holds a rational support zone.
- Targets: initial take-profit near $0.34, then reassess with momentum.
Risk, stops & sizing
- Stop: place under the structural support with a buffer (e.g., 3–6% depending on recent volatility).
- Position sizing: risk 1% of portfolio; in fast-moving tokens like WLD, consider smaller absolute exposure and tighter stops.
BTC correlation & roadmap
- Correlation: WLD’s speculative flows will widen when BTC moves; an aggressive BTC sell-off can erase mean-reversion upside quickly.
- 1-week: expect a short-term oversold bounce candidate — confirm with MACD/RIS signals.
- 1-month: if the bounce reaches $0.34 and MACD turns positive, you can trail into a larger swing; otherwise, preserve capital and wait for clearer structure.
(Technical note highlights oversold conditions and the $0.34 recovery level.) WLD technical note
Practical execution checklist for intermediate swing traders
- Only trade on confirmed triggers (RSI stabilizing/recovering and MACD cross or histogram expansion) rather than on hope.
- Size positions to a fixed portfolio risk (1% default). Use the position-size formula above for exact shares/units.
- Use stops under structure — never a fixed-percent-only stop without context for small caps.
- Manage correlation risk: if BTC breaches key support, either reduce exposure across all alt positions or tighten stops.
- Use partial profits: take some off at the first target and trail the remainder.
- Keep an eye on orderbook liquidity and gas/fees; execution matters for small-cap swings.
These setups are tactical and short-term; combine them with macro awareness and use Bitlet.app or your preferred execution layer to manage limit/stop orders efficiently.
Sources
- https://blockchain.news/news/20260322-price-prediction-pepe-technical-correction-could-test-key-support
- https://blockchain.news/news/20260322-price-prediction-wif-dogwifhat-targets-021-breakout-amid-technical
- https://blockchain.news/news/20260322-hbar-price-prediction-targets-010-recovery-by-april-2026
- https://blockchain.news/news/20260322-price-prediction-op-optimism-eyes-013-recovery-after-testing
- https://blockchain.news/news/20260322-price-prediction-sui-targets-105-breakout-by-early-april
- https://blockchain.news/news/20260322-price-prediction-wld-worldcoin-eyes-034-recovery-amid-oversold