Reconciling Mixed Bitcoin Signals: A Practical Trade Framework for Mid‑March 2026
Summary
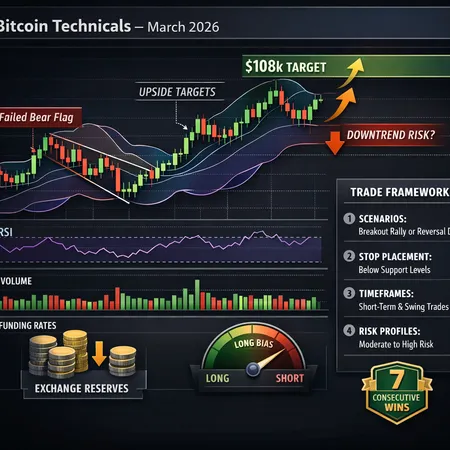
Why mid‑March 2026 feels like a tug‑of‑war
Bitcoin is trading under conflicting inputs: price action shows a recent bear‑flag top that failed to hold (a rejection reported near the mid‑$70k area), while volatility indicators and a run of consecutive up days are arguing for a meaningful move higher. The rejection near the flag top is highlighted by market technicians as a warning the prior uptrend may have exhausted, and is discussed in the analysis of the pattern and rejection near $76k. At the same time, studies of Bollinger Bands suggest a squeeze that can precede sharp moves higher — one write‑up even frames a path toward $84k if momentum resolves favorably. Coverage of Bitcoin’s rare multi‑day winning streak adds context: streaks can produce overbought conditions yet still precede further continuation if volume and on‑chain flows cooperate.
Reconciling these signals is not about choosing one and ignoring the other. It's about constructing a rules‑based framework that accepts both outcomes and defines how to act depending on what price and on‑chain data confirm next.
The signals — what they actually mean (and their limitations)
Bear flag rejection (price structure)
A failed bear‑flag breakout or top rejection near a prior pivot is a structural bearish read: it shows sellers stepping in at a supply zone. That matters because structure often trumps oscillators in short windows. The immediate risk: a break below the flag's lower trendline or key support could accelerate selling as short‑term traders flip or stop out.
Limitations: a single rejection doesn't guarantee a multi‑week downtrend; it tells you that, at that moment, supply exceeded demand at that level. Confirm with follow‑through (volume, candle closes, and lower lows).
Bollinger Bands squeeze and volatility rhythm
Bollinger Band compressions indicate reduced volatility that historically precedes expansion. The technical case for a near‑term move higher — with measured targets up to the mid‑eighties and beyond — rests on band expansion aligned with momentum. See the technical perspective arguing a powerful move as bands warn of volatility.
Limitations: squeezes are neutral; they tell you volatility will likely rise but not the direction. Direction needs a breakout confirmation and ideally supportive volume/on‑chain flow.
Consecutive winning days and overbought readings
An 8‑day win streak is notable and historically rare; it can indicate strong buyer conviction or a short squeeze. Yet streaks can also leave price overbought and vulnerable to quick mean‑reversion if liquidity dries up or large holders sell into strength. Coindesk described the recent rare streak and the overbought context.
Limitations: streaks are descriptive, not predictive. Combine with liquidity and funding signals.
Key on‑chain measures to include and how to read them
- Funding rates: Positive funding (longs pay shorts) suggests leverage on the long side — a short‑term tailwind for continuation but also a crowded trade prone to violent liquidation if funding flips. Use funding as a contrarian thermometer for overleveraging.
- Exchange reserves: Declining reserves generally support price (less sell pressure available). Rising reserves can foreshadow distribution. Track weekly changes more than daily noise.
- Long‑Term Holder (LTH) behavior: Increasing LTH reserve or declining movement indicates accumulation and structural support. Large LTH sells during rallies can cap upside.
Weight these like this: for trades under two weeks, give technical price structure and funding rates ~60–70% of your decision weight and exchange/LTH signals ~30–40%. For multi‑month directional positions, flip the weight: on‑chain (LTH distribution, reserves) should carry more weight, because they reflect supply changes.
A rules‑based trade framework: scenarios, triggers and stops
Below are three primary scenarios with concrete rules, targets and stop placement. Each scenario includes timeframes and a guidance on how to size positions across risk profiles.
Scenario A — Bullish continuation (confirmation required)
- Trigger: Daily close above the recent bear‑flag high (clear break and hold above the $76k pivot mentioned in price studies) with expanding Bollinger Bands and above‑average volume. Funding remains neutral to modestly positive but not excessive, and exchange reserves continue to fall.
- Targets: Stage targets — first target $84k (short‑term measured move), secondary extension $100k–$108k if momentum sustains and on‑chain flows support (lower reserves, LTH accumulation).
- Timeframe: swing (1–6 weeks) to intermediate (1–3 months) for extension.
- Stop placement: for aggressive traders use a stop below the breakout candle low or the band pivot (example: 3–5% below entry). For balanced traders set a stop below the breakout confirmation level or the flag lower trendline (
6–10% depending on volatility). For conservative traders wait for a retest of the breakout and place stops below the retest (8–12%). Consider ATR‑based stops: 1.5–2× daily ATR for intraday/swing entries.
Scenario B — Bearish breakdown (confirmation required)
- Trigger: Failure to reclaim the flag high followed by a verified daily close below the flag's lower trendline or key support (e.g., a firm close below the 200‑hour or a multi‑day structural pivot) and rising exchange reserves or a dump in LTH balances.
- Targets: Initial target is the nearest demand cluster ($68k–$72k), secondary target $60k–$64k if momentum accelerates and funding flips negative (shorts paying longs).
- Timeframe: swing (days–weeks).
- Stop placement: short trades can use stops above the last swing high or above the failed breakout (5–8% for balanced, wider for conservative). Use reduced leverage when funding becomes heavily negative or volatile.
Scenario C — Range / neutral (manage for directionless risk)
- Trigger: Price chops between the flag high and the lower support without decisive band expansion; funding oscillates around neutral and LTH/ reserve flows are ambiguous.
- Plan: Avoid directional overweights. Trade volatility with defined intraday ranges (buy low of range, sell high) or trade smaller size. Alternatively, use options (debit spreads or iron condors) to profit from low volatility if available.
- Stop placement: tight, structure based — below/above intra‑range pivots (2–4% depending on timeframe).
Position sizing and risk profiles (concrete examples)
Use risk per trade as a percentage of equity (not notional). Examples assume a $100,000 account.
- Conservative (1% risk per trade): risk $1,000. If stop is set 6% away, max position size = $1,000 / 6% ≈ $16,666 notional (≈0.18 BTC at $90k). Favor smaller notional, wider stops only with smaller size.
- Balanced (2% risk): risk $2,000. With an 8% stop ⇒ $2,000 / 8% = $25,000 notional.
- Aggressive (4–5% risk): risk $4,000–$5,000. With a 10% stop ⇒ $40,000–$50,000 notional.
Leverage: use minimal leverage around macro events; increase only when funding is favorable and liquidity is clear. Funding spikes signal crowded leverage; reduce size.
How to combine on‑chain vs technicals in practice
- Establish the base case from price structure (trendlines, support/resistance, moving averages). This defines immediate risk levels and stop placement. 2. Check volatility context with Bollinger Bands: a squeeze signals an imminent expansion — prepare for a high‑impact move and avoid oversized entries until direction confirms. 3. Use funding rates to size and time entries: if funding is sharply positive and you’re considering a long, reduce size because the trade is crowded. 4. Let exchange reserves and LTH change the bias: falling reserves and increasing LTH balance toward accumulation supports bullish continuation; rising reserves during rallies warn of distribution.
Weighting example for a 2‑week swing trade: technical structure 60%, Bollinger/volatility 20%, funding 10%, reserves/LTH 10%. For a position intending to hold 2–6 months: reserves/LTH 50%, technical 30%, funding 10%, volatility 10%.
Execution and trade management rules (simple, repeatable)
- Pre‑define entry, stop, target, and size before entering. Avoid adding size into weakness unless part of a preplanned pyramiding rule (e.g., add 25% size on a confirmed retest with improved on‑chain flows).
- Use limit orders at structure levels to avoid sloppy fills.
- Scale out: take partial profits at the first target (e.g., 33% at $84k), let the rest run with a trailing stop (e.g., 1.5× ATR trailing or below higher timeframe pivot).
- If funding spikes (>0.10% per 8h or platform‑specific high), tighten stops or reduce size. If reserves jump meaningfully within a week, consider reducing exposure.
Example trade plans (short, swing, position)
- Short (aggressive intraday): If price rejects the $76k level intraday with high volume and a falling 1h VWAP, short with a 2–3% stop above recent high; target 5–8% for quick scalp. Keep position small (~0.5–1% of equity risk).
- Swing long (balanced): Wait for daily close above $76k + Bollinger expansion; enter 50% at breakout, 50% on a retest. Stop 6–8% below entry. Target $84k for partial, trail remainder to $100k–$108k.
- Position (conservative): If on‑chain shows sustained LTH accumulation and declining reserves despite short‑term noise, enter small staggered buys on pullbacks (DCA), allocate no more than 2–4% account per tranche, and hold with wider stops tied to structural breakdowns.
Checklist before entering any trade
- Does price confirm the scenario (close/timeframe match)?
- Are funding rates reasonable relative to your position direction? (Reduce size if extreme.)
- Are exchange reserves or LTH flows contradicting the setup? If yes, reduce conviction or require stronger price confirmation.
- Is liquidity sufficient for your order size (slippage checks)?
- Have you predefined stop, size and a plan for partial profits?
Final thoughts: keep the framework adaptive
Mixed signals are normal in markets, especially around regime shifts. This rules‑based approach reduces emotion: define which inputs you prioritize for each timeframe, size according to stated stop distance, and treat on‑chain and technical signals as complementary rather than binary. For traders looking for platform tools to execute such rules quickly, services like Bitlet.app can be part of a broader workflow, but the trading edge is the plan and discipline.
Sources
- Bitcoin hits bear flag top, gets rejected at 76k — CryptoDaily
- Bollinger Bands warn of volatility, technical case for move near $84k — Cointelegraph
- Bitcoin’s rare 8‑day winning streak and overbought context — Coindesk
For further reading on market structure and volatility signals, many active traders keep reference pages for Bitcoin and broader DeFi ecosystem flows to cross‑check macro liquidity conditions.


