Litecoin Price Prediction: Why Analysts Target $62–65 in April 2026 and How to Trade It
Summary
Executive summary and trade thesis
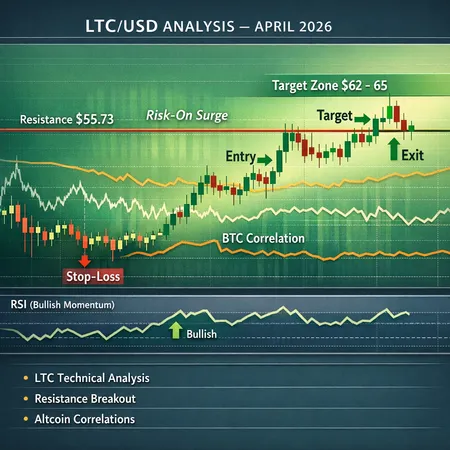
Litecoin (LTC) is setting up for a potential short-term leg higher: several analysts are targeting $62–65 in April 2026 if LTC clears and sustains a breakout above $55.73. That target is anchored in technical resistance levels and momentum readings — notably the RSI — and is supported by this week's broader crypto risk-on impulse that put roughly $100 billion back into markets, a tailwind for altcoins.
This article unpacks the LTC technical analysis behind the $62–65 prediction, identifies the momentum and price levels that matter, and gives actionable trade ideas (entries, stops, targets, and contingency plans). It also explains how correlation with Bitcoin and institutional flows could amplify or invalidate the breakout thesis.
Market context: why now matters
A one-day, large-cap market surge this week — which added around $100B to crypto market capitalization — increased risk appetite across spot and derivatives desks and helped push traders back into altcoins. That kind of liquidity rotation is exactly the environment in which an alt like LTC can outperform in the short run, especially after a consolidation phase. Read more on the market spike and risk-on flows here.
At the same time, the specific LTC price prediction and the key technical levels were recently highlighted in market notes and price studies; the $62–65 short-term target and the critical resistance level around $55.73 are summarized in analyst coverage. See the technical note for the $62–65 outlook here.
LTC technical snapshot: levels that matter
- Key resistance: $55.73 — this is the breakout level analysts are watching; a clean hourly/daily close above it with volume would be bullish.
- Short-term target: $62–65 — the measured move if resistance is taken out and momentum remains intact.
- Immediate supports to watch if the breakout stalls: $50 (psychological/support pivot), $45 (recent congestion), and $38 (deeper support and previous swing lows).
Momentum indicators
- RSI: The Relative Strength Index is the immediate momentum readout. A move above 50 confirms bullish momentum; a clean expansion toward 70 signals strong follow-through but also raises overbought flag. Watch for RSI divergence: price making higher highs while RSI fails to confirm is a classic early warning of a false breakout.
- Volume and on-balance indicators: Breakouts without accompanying volume are suspect. The target zone ($62–65) becomes less credible if price ticks above $55.73 on muted volume.
Moving averages and structure
- Expect the 50-day and 200-day moving averages (or EMAs on the timeframe you trade) to act as dynamic support/resistance. Crosses or confluence with $50–$45 would strengthen those support levels.
(For the specific market note that calls out $55.73 and the April 2026 target, see this technical write-up.)(https://blockchain.news/news/20260310-price-prediction-ltc-targets-62-65-by-april-2026)
Technical triggers: precise entry and exit rules
Below are trade-ready setups for intermediate traders who want a clear, repeatable plan.
- Aggressive breakout entry (higher conviction, higher risk)
- Entry: Market or limit buy once LTC prints an hourly/daily close above $55.73 with above-average volume.
- Stop: Place a stop-loss just below the breakout zone, e.g., $52 (≈5–6% below entry if you buy near $55.73). Tighten stops if you scale in.
- Target: $62 first take-profit (TP1), $65 as extended TP (TP2). Consider scaling out: 40% at TP1, 30% at mid-level, 30% hold to TP2.
- Rationale: A confirmed breakout with volume signals demand; stop below breakout captures failed breakout risk.
- Conservative pullback entry (lower risk, better risk-reward)
- Entry: Wait for a retest of the breakout as new support (price pulls back toward $55–$50 and finds support on increased buy volume).
- Stop: Below the retest low or the next structural support (e.g., $48–$50 depending on retest), limiting risk to ~3–6% on the position.
- Target: Same as breakout plan: $62–65.
- Rationale: Buying a validated retest reduces the odds of being trapped in a false breakout.
- Scaling and size management
- Risk no more than 1–2% of account equity on this trade (position sizing per your risk parameters). Use multiple entries: e.g., 50% at breakout, 50% on a successful retest.
- Alternatives and intraday setups
- Momentum scalpers can trim into quick moves above $55.73 with very tight stops (2–3%) and shorter targets; swing traders should prefer the retest approach.
Stop placement, drawdown planning, and trade management
- Initial stops should be mechanical and based on price structure, not emotion. Use the breakout zone and nearby support pivots as stop anchors (example stops above).
- If the trade reaches TP1, move the stop to breakeven on the remaining size; trail aggressively as price approaches TP2.
- Prepare for volatility: altcoins can reverse quickly. If LTC loses $52–50 after a breakout, accept the loss and re-evaluate rather than averaging into a failing setup.
If resistance fails: probable scenarios and fallout
- Failed breakout and quick retrace
- If price spikes above $55.73 but is rejected and closes back below the level on high volume, that’s a classic false breakout. Expect a fast re-test of $50 and potentially $45.
- Trading reaction: stop out on the breakout leg, look for short-term short opportunities only if volume confirms a breakdown.
- Consolidation above breakout
- Price may chop between $55–58 for several sessions as liquidity builds before a second leg. That’s normal; patience here often pays.
- Systemic risk (BTC-led selloff)
- If Bitcoin fails in a decisive way or liquidations hit institutional flows, LTC can underperform even on technical breakouts. Correlation can amplify downside quickly.
Correlation with Bitcoin and institutional flows — amplifier or dampener?
Litecoin historically correlates with BTC direction on both momentum and sentiment swings. Two structural amplifiers matter here:
Macro / BTC direction: If BTC extends the current risk-on move and new buyers rotate into BTC-led alt rallies, LTC benefits via correlation and flows. Conversely, if BTC pulls back hard, altcoins typically underperform; any LTC breakout can be negated by a BTC drawdown.
Institutional and liquidity flows: This week’s ~$100B market surge indicates fresh liquidity and risk tolerance returning to markets, a favorable backdrop for altcoin rotation (source). If institutions keep allocating to crypto or if large retail flows return, LTC has a clearer path to $62–65. However, the move relies on continued risk appetite; if flows reverse, the breakout becomes vulnerable.
For context on the week’s market surge and how it lifted risk assets, see this market coverage.
Practical trading checklist (before pressing buy)
- Has LTC closed above $55.73 on the timeframe you trade (hourly/daily)?
- Is volume above the recent average on that breakout candle?
- Is RSI confirming momentum (above 50 and rising), without negative divergence?
- Do BTC price action and broader market flows support risk-on bias?
- Have you sized the position so that the stop equals 1–2% of account equity?
- Do you have predefined TP1 and TP2 and a plan to move stop to breakeven?
If you answered yes to most of these, the risk-reward profile for a breakout trade is reasonable for intermediate traders.
Example trade (numeric):
- Account equity: $50,000. Risk per trade: 1% = $500.
- Aggressive entry at $56 (rounding), stop at $52 → risk per unit ≈ $4. Position size ≈ 125 LTC units (500/4 = 125). Adjust rounding and fees.
- TP1 at $62: gross gain ≈ $6 × 125 = $750. TP2 at $65: gross gain ≈ $9 × 125 = $1,125. Always factor fees/spreads and partial exits.
(This is an illustrative example, not financial advice.)
Final notes and monitoring
The $62–65 Litecoin price prediction for April 2026 is a clear, tradeable target if LTC secures the $55.73 breakout with momentum confirmation. But altcoin moves live or die by flow and correlation to BTC; watch macro liquidity, derivatives open interest, and on-chain exchange flows. Use mechanical stops, scale entries, and respect the plan.
Track positions and set alerts on your platform of choice — Bitlet.app is one of the venues traders use to monitor swings and implement P2P or structured trades within their broader portfolio.
Sources
- Litecoin technical note: Price prediction and resistance levels — https://blockchain.news/news/20260310-price-prediction-ltc-targets-62-65-by-april-2026
- Market context: crypto market added ~$100B in a day — https://cryptopotato.com/hyperliquid-hype-rockets-by-double-digits-bitcoin-btc-tops-71k-market-watch/


