Memecoin Momentum: How Exchange Flows, Funding Rates, and Retail Demand Are Driving SHIB, DOGE, and PEPE This Week
Summary
Executive snapshot: what happened this week
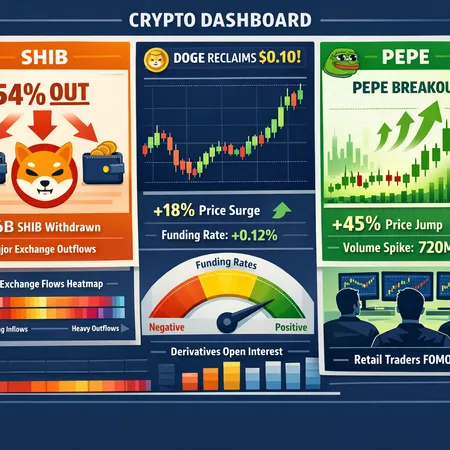
This week the memecoin complex reasserted itself as a retail-driven market focal point. On-chain and exchange data showed massive SHIB withdrawals, Dogecoin briefly reclaimed the psychological $0.10 level, and PEPE posted explosive intraday moves during a broader altcoin rally. For traders and community managers, those three datapoints — exchange flows, pricing thresholds, and derivatives positioning — form a practical triage for judging whether a move is sustainable or a flash squeeze.
Market news feeds captured the headlines: reports noted approximately 45 billion SHIB left exchanges in a 24‑hour window, a signal many interpreted as bullish supply squeeze potential. For broader context, mainstream market overviews tied altcoin strength to Bitcoin’s creeping bid near a key breakout level. See the market roundup at CoinDesk for the macro picture. Bitcoin acting as a bellwether matters because memecoin cycles often run on liquidity and sentiment cascades from BTC and major altcoin flows.
Why exchange outflows matter for memecoins
Large withdrawals from exchange wallets typically mean one of two things: long-term accumulation (hodling) or transfer to custodial/OTC desks for large off-exchange trades. For memecoins, which rely heavily on retail liquidity and a relatively small pool of active sellers, even modest reductions in exchange balance can materially reduce available sell-side depth.
The SHIB example this week was stark: reports documented ~45 billion SHIB leaving exchange custody over 24 hours. That kind of outflow reduces the immediate supply market makers and takers see, which increases the probability that the next large buy will push price sharply higher. The U.Today report on the SHIB withdrawals highlighted this dynamic and why many traders viewed the move as bullish.
But a few caveats:
- Not all withdrawals are bullish. Transfers to cold wallets can be accumulation, but transfers to OTC desks or mixing services can precede large sales off-exchange. Track counterparty addresses and label flows where possible.
- Scale matters. For small-cap memecoins, tens of millions of tokens moved off-exchange might be big; for larger caps, you need billions.
Reading exchange flow data well means pairing raw outflow numbers with exchange balance trends (net flow over days), wallet labeling, and order book depth. A single-day spike is interesting; a multi-day downtrend in exchange balances is more meaningful.
Derivatives positioning and funding rates: the pressure gauge
Derivatives markets — perpetual swaps in particular — give a near-real-time read on trader sentiment and leverage. Funding rates tell you who’s paying whom: positive funding means longs pay shorts (bullish but levered), negative funding means shorts pay longs (bearish pressure).
High, persistent positive funding on a memecoin signals a crowded long trade. That crowding creates fragility: if price falters, liquidations cascade, funding compresses, and the move can reverse violently. Conversely, neutral or slightly negative funding with rising spot price suggests buyers are not excessively levered — a healthier rally.
Open interest (OI) and the OI-to-volume ratio matter too. Rising OI alongside rising price — especially when funding is elevated — is a classic blow-off setup. If price climbs while OI falls, that’s often indicative of spot buyers driving price and leveraged traders trimming exposure.
Consider Dogecoin’s reclaim of $0.10: retail FOMO and derivatives desks both responded. Coverage noted retail buying and derivatives interest as fueling the move. Monitoring platform-specific funding rates (e.g., Binance, Bybit) lets you see where the pressure concentrates. Invezz’s coverage of DOGE hitting $0.10 highlights how retail demand and derivatives flows interplay during such psychological breakouts.
Practical flags from funding and derivatives
- Funding above 0.05% (8‑hour) on a memecoin: approach cautiously; the trade is likely levered and vulnerable.
- Sharp spike in OI with order books thin on the sell-side: high squeeze risk.
- Divergence: price up + OI down = cleaner retail-led buy; price up + OI up = speculative leverage.
Case studies: SHIB, DOGE, PEPE this week
SHIB: exchange outflows and supply squeeze dynamics
The ~45 billion SHIB outflow story was more than a headline — it reduced visible exchange supply and shifted the marginal seller dynamic. When exchange balances decline over multiple consecutive days, even small retail buys can generate outsized price moves because market makers widen spreads or pull inventory.
Combine that with subdued derivatives speculation (if funding is low) and you have a slow, durable lift. If funding is high, however, the move can become a short-term squeeze followed by a rapid unwind. Use on-chain explorers to confirm where tokens went (cold storage vs custodial). See the U.Today report for the initial withdrawal figures.
DOGE: psychology, level breaks, and retail demand
Dogecoin reclaiming the $0.10 mark is as much psychological as it is technical. Round numbers attract headlines and retail order clusters. In the most recent move, retail bidding and options/derivatives interest contributed to momentum, as noted in the Invezz coverage.
Retail-led breaks often see heavy retail buy volume on centralized exchanges and pumpy social media narratives. That can be sustained if the broader market is risk-on and BTC is stable; it can collapse if derivatives funding turns sharply negative or liquidity providers step back.
PEPE: explosive intraday moves and the altcoin rally
PEPE’s 18% intraday move during this week’s altcoin surge is a good example of how memecoins amplify market emotion. CryptoPotato’s market watch captured PEPE’s rapid spike during a general appetite for riskier alts. Small caps like PEPE trade on thinner books and are prone to vertical moves — both up and down.
When altcoin appetite returns, capital rotates from Bitcoin into alts and memecoins. Watch relative volume and bid-ask spreads on the token’s main pairs. If PEPE’s price moved while BTC was inching higher toward a breakout (as CoinDesk summarized), that alignment made the rally more robust — but still fragile due to leverage and retail concentration.
How to read exchange flow metrics — a step-by-step guide
- Net flow vs gross flow: focus on net exchange flow (inflows minus outflows) over 24–72 hours. Spikes in outflows are notable; sustained net outflows are more meaningful.
- Exchange balance trend: look at the exchange’s total token balance over 7–30 days. A downtrend suggests accumulation or liquidity drain.
- Whales vs retail: where possible, use on-chain analytics to tag large addresses. A few addresses pulling large balances are different from thousands of small withdrawals.
- Pair-level order book depth: check the USDT/BASE pair order books. Low depth at 1–3% moves gives a sense of how far price can move on moderate-sized buys.
- Volume and concentration: compare 24‑hour volume to the token’s market cap. Low volume with sudden price moves often means illiquidity-driven volatility.
Tools: on-chain explorers, exchange API pulls for balances, and analytics dashboards (many traders use bespoke tracking or services; Bitlet.app users often integrate exchange metrics into their research workflow).
Funding rates, open interest and what they tell you in practice
- Pull funding rates from 2–3 major derivatives venues. Memecoin flows are often venue-specific; a crowded position on one exchange can spark a localized squeeze.
- Track 8‑hour funding and 24‑hour average funding. Sudden surges in funding often lead to short-term corrections.
- Open interest rising with price signals speculative leverage. If OI falls while price rises, the rally has more organic spot participation.
Quick heuristic: if funding > 0.03% (8‑hour) for two or more exchanges and OI is rising, treat the trade as high-risk — use tighter stops and smaller position sizes.
Position sizing and risk management for meme-asset trades
Memecoins are high volatility, high-risk instruments. Position sizing should reflect that.
Practical rules:
- Max risk per trade: 0.5–1.5% of total portfolio capital for many retail traders — reduce further if you’re trading highly levered derivatives.
- Use dollar-risk sizing: determine distance from entry to planned stop-loss, then size position so that the dollar loss equals your target risk. Example: account $10,000, risk 1% = $100. If stop is 20% away, position size = $100 / 0.20 = $500.
- Prefer spot or low leverage when funding rates are high. Perpetual swaps with high funding can blow accounts during squeezes.
- Staged entries and exits: tranche buys (e.g., 50/30/20) and take-profits in layers to avoid full exposure at the top.
- Use trailing stops but be aware of liquidity gaps; wide stops in thin order books can mean worse execution.
Community managers should also plan for social and liquidity impacts: coordinate announcements to avoid accidentally creating runs to centralized exchanges, which can spike inflows and reverse the effect of off-exchange accumulation.
Signals that often precede sudden reversals
- Rapid funding spikes across exchanges.
- Large off-exchange sell indications (e.g., tokens moving to addresses associated with OTC desks).
- Volatility divergence: realized volatility surging while implied (options) skew drops — a sign of short-term panic.
- Price-up + OI-up + thin order books = classic blow-off top.
If you see two or more of these concurrently, reduce exposure, tighten stops, or avoid initiating new long positions until conditions normalize.
Putting it together: a simple memecoin trade framework
- Pre-trade checklist: net exchange flows over 72h (prefer net outflows), funding rates (prefer neutral or slightly positive), OI trend (prefer flat or falling), order book depth (sufficient for your size).
- Entry: staggered buys with defined dollar-risk per tranche.
- Risk control: initial stop based on order book support levels or volatility multiple (e.g., 1.5–2 ATR), position sized so max loss = target % of portfolio.
- Exit: take partial profits at predefined levels; re-evaluate if funding spikes or OI surges.
This framework is intentionally simple — memecoin markets move fast and require adaptable rules rather than rigid models.
Conclusion: nimble, data-driven trading beats hype
This week’s memecoin action — SHIB’s large exchange outflows, DOGE reclaiming $0.10, and PEPE’s explosive moves — reinforced how retail demand, liquidity shifts, and derivatives positioning interact to create rapid rallies and equally fast reversals. Read exchange flows for supply pressure, watch funding rates and OI for leverage risk, and size positions so a single trade can’t meaningfully damage your account.
For active trackers, combine on-chain labels with exchange-level funding data and keep an eye on broader market cues from BTC and major alts. Tools and dashboards (including integrations available on services like Bitlet.app) can speed this monitoring, but discipline and position sizing ultimately determine survival in memecoin cycles.