Dissecting the Hyperliquid HYPE Rally: From Hayes’ $150 Call to Volume Spike and Risk Assessment
Summary
Quick timeline and market context
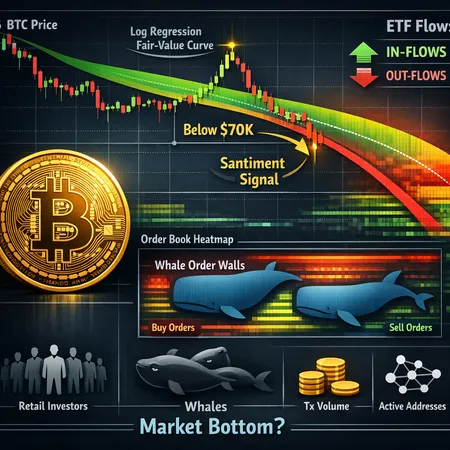
In late-stage moves around the rally, a few clear signals appeared in rapid succession: a high-profile price call from Arthur Hayes, sudden spikes in volume and price for the HYPE token, and broader crypto exuberance with Bitcoin showing strength. Media outlets picked up the pattern: initial coverage noted a double-digit HYPE surge as BTC topped the low $70k region, connecting part of the momentum to broader market optimism and liquidity rotation into altcoins (CryptoPotato).
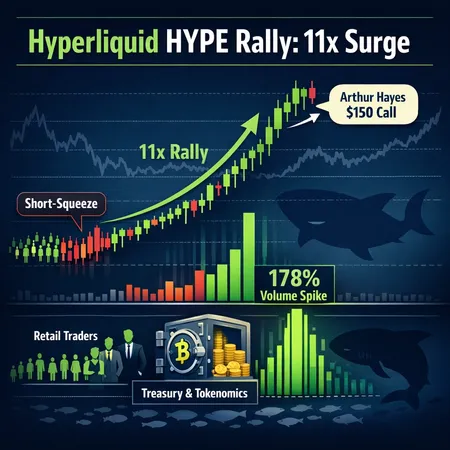
Within hours and days, coverage tied Hayes’ $150 prediction to fresh retail interest and record trading volumes. DailyCoin highlighted the role of Hayes’ public call and noted unusually high volumes as a core fuel for the move (DailyCoin). Parallel reporting put specific numbers on that trading activity: one outlet recorded a 178% jump in 24‑hour volume and documented price recovery up into the low $30s for HYPE during the run (U.Today). Blockonomi framed the headlines around a mid-day 11% intraday rally following Hayes’ reveal (Blockonomi).
Those datapoints—Hayes’ call, double-digit price moves, and a ~178% volume spike—create a compact causal narrative, but causality is rarely so simple. Below we parse the evidence and show what to look for when deciding whether to trade or hold.
Which forces can create quick altcoin rallies?
Altcoin rallies of this shape are typically powered by one or a mix of three forces:
Retail-driven FOMO and social amplification. Influential public statements (podcasts, tweets, newsletter calls) can concentrate attention on a token and trigger rapid inflows from retail traders. Volume surges of the magnitude reported for HYPE often accompany this pattern. Media lift following Hayes’ call is consistent with this channel (DailyCoin).
Institutional market-making or coordinated liquidity provision. Market makers and professional desks can inject or absorb liquidity to smooth order books, and sometimes participate as directional liquidity. Their activity tends to show up as reduced spreads, deeper orderbook depth, and more continuous two‑sided liquidity over time rather than sharp spikes with thin books.
Tokenomics and treasury actions. Large treasury buys, token burns, or scheduled vesting/repurchase events can materially change available float and price dynamics. These leave on‑chain footprints: large transfers, sudden contract interactions, or companion announcements from the protocol treasury.
For HYPE, the timeline and reporting favor a heavy retail/social component: Hayes’ $150 call was widely circulated, and outlets specifically connected his call to volume surges and intraday rallies (Blockonomi; DailyCoin). The 178% 24‑hour volume spike reported by U.Today is a classic sign of concentrated attention rather than slow, institution-led accumulation (U.Today). Still, several additional tests help separate retail mania from structural flows.
How to tell who’s really behind the move: on‑chain and market signals
Below are the concrete signals to examine (and why they matter). For active altcoin traders and community managers, these are the metrics to check immediately after a headline-fueled move.
Exchange order book depth and spread: Thin books and wide spreads before the rally, with a sudden sweep of liquidity, suggest retail swoops and stop-hunts. Sustained tight spreads and deeper resting bids imply market-maker participation.
Exchange and DEX volume split: If most volume is on a single centralized exchange or a few retail‑centric venues, that points to retail; large, balanced DEX liquidity suggests programmatic or treasury-driven activity.
Top-holder concentration and recent transfers: Look for large wallets moving tokens to exchanges (sell pressure) or to cold storage (accumulation). If a few wallets hold a high percentage of circulating supply, the risk of coordinated selling or price manipulation rises.
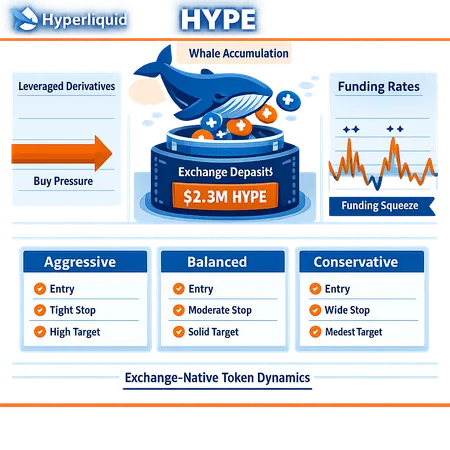
Funding rates and open interest on perpetuals: Extremely skewed funding (longs paying shorts or vice versa) and rising OI before the spike indicate leverage and the potential for a short-squeeze if those positions unwind.
On-chain treasury activity and contract interactions: Large contract calls flagged in mempools, or treasury buys, can point to protocol-driven support. Conversely, scheduled unlocks or vesting can preface supply shocks.
Applying these tests to HYPE with currently published data: media reports emphasize the volume jump and Hayes’ signal, and they do not document large, sustained orderbook depth or treasury buybacks. That makes the retail-social hypothesis most plausible as the primary initial driver, with the remaining possibilities still open but less supported by public reporting (CryptoPotato; U.Today).
Short‑squeeze risk and how to read it in real time
Short‑squeezes occur when concentrated short positions are forced to buy (cover) as price moves sharply higher, creating cascades. Indicators that a rally is being amplified by short covering include:
- A rapid, sharp price move accompanied by a large spike in volume and funding rate reversals.
- Rising liquidation notifications on derivatives platforms and surges in open interest followed by quick drop-offs as positions close.
- Price motion that gaps through typical resistance levels without corresponding increases in long-term open interest.
HYPE’s reported 11% intraday jump and 178% 24‑hour volume surge are the kinds of inputs consistent with short-covering pressure, but causality isn’t proven: retail buying can produce the same signature. Traders should watch funding rates and exchange liquidation feeds to see whether the rally is self‑sustaining or built on squeezed leveraged shorts (Blockonomi).
Liquidity and concentration: structural red flags
Two structural metrics should increase a trader’s caution dramatically:
High holder concentration: If a small number of wallets control a large portion of tokens, a coordinated sell or a large single exit can wipe out price gains quickly. Without on‑chain evidence of distribution to retail wallets, assume concentration risk is nontrivial.
Low realized liquidity at relevant price levels: Check the cumulative bids/asks in the order book across major venues. If there’s only a small amount of depth below the current price, a 10–20% down move can cascade into a liquidity vacuum.
Given the speed of the HYPE move and the media-driven attention, both these factors are plausible concerns. Community managers should publish clear treasury and vesting schedules to reduce uncertainty; traders should treat the token as high‑beta and size positions accordingly.
Actionable takeaways for altcoin traders (entry, sizing, and stop rules)
Below is a practical checklist and a simple position-sizing framework tailored to high‑signal, headline-driven altcoin rallies such as HYPE.
Checklist before entering:
- Confirm the exchange/DEX where most volume is happening and check orderbook depth across the top two venues.
- Glance at funding rates and open interest to detect leverage build-up.
- Scan on‑chain for large transfers in the last 24–72 hours (treasury moves, wallet exits).
- Note any scheduled token unlocks or announced treasury actions.
Position-sizing rules (high risk altcoins):
- Base allocation: allocate no more than 1–3% of your total portfolio to a single high‑volatility altcoin motivated by social headlines. If you are a more aggressive trader with strict risk controls, you might use up to 5% but only with tighter risk rules.
- Scaled entries: split the intended allocation into 3 tranches (33/33/34%). Buy the first tranche on a reasonable pullback or on limit orders, add the second if momentum confirms (e.g., new local high with supportive volume), and reserve the final tranche for a meaningful breakout above structural resistance supported by sustained volume.
- Stop placement: for headline-driven rallies, use tighter stops (6–12% depending on intraday volatility) or use ATR‑based stops on shorter timeframes. Prefer limit or post-only orders to avoid slippage in thin markets.
- Profit-taking: target staged profit-taking (e.g., 30–50% of position at defined resistance zones) rather than all-or-nothing exits.
Risk-monitoring during the trade:
- Watch funding rates and liquidation feeds closely; a sudden spike in funding or a drop in OI can signal exhausted leverage.
- Monitor top‑holder activity on-chain; sudden transfers to exchanges are a red flag.
- Keep an eye on market‑wide DeFi and BTC sentiment — if BTC rolls over, altcoin bids often evaporate fast.
Practical order tactics:
- Use limit buys staggered across multiple price levels rather than large market orders.
- If liquidity is poor, consider reducing position sizes and accepting partial fills.
- For larger positions, use OTC or P2P facilities where available; platforms like Bitlet.app provide alternative settlement options to avoid slippage on thin order books.
Final assessment: sustainability and risk bucket
Putting the evidence together: the HYPE rally shows strong signatures of a social/retail-led move amplified by a high-profile figure (Arthur Hayes). The double-digit intraday gains, heavy short-term volume spike (~178%), and press narratives linking Hayes’ call to spikes make retail FOMO the most likely primary driver in the short term. There is not yet public reporting of sustained liquidity provisioning or a treasury-led buyback that would indicate structural support.
Sustainability outlook:
- Short term (days–weeks): high probability of volatility and pullbacks. The rally is likely fragile unless follow‑through appears as deeper order books, sustained DEX liquidity, or treasury actions.
- Medium term (weeks–months): depends on utility-driven adoption, distribution of tokens to a broader holder base, and whether core protocol fundamentals (product use, fees, integrations) materialize.
Risk bucket: treat HYPE as high‑risk, high‑reward. Expect large intraday swings, require strict position limits, and prioritize real-time monitoring tools.
Practical closing notes for community managers and traders
Community managers acting to stabilize token dynamics should prioritize transparent communication: publish vesting tables, treasury intent, and any market‑making agreements. For traders, the single most useful heuristic is simple: if a rally is driven primarily by an influential call and short-term social momentum, treat it as a trade, not an investment, and size positions accordingly.
If you trade these moves, keep a checklist handy (orderbook depth, top‑wallet flows, funding rates, OI, and media cadence) and stick to scaled entries and predefined exits. That discipline differentiates opportunistic, repeatable traders from those caught in headline whiplash.
Sources
- CryptoPotato — Hyperliquid HYPE rockets by double digits; BTC tops $71K
- DailyCoin — HYPE token surges following Arthur Hayes’ $150 price call
- U.Today — 178% in volume in 24 hours: Hyperliquid’s HYPE enormous and unexpected recovery
- Blockonomi — Hyperliquid HYPE token rallies 11% after Arthur Hayes reveals $150 price prediction