Volatility
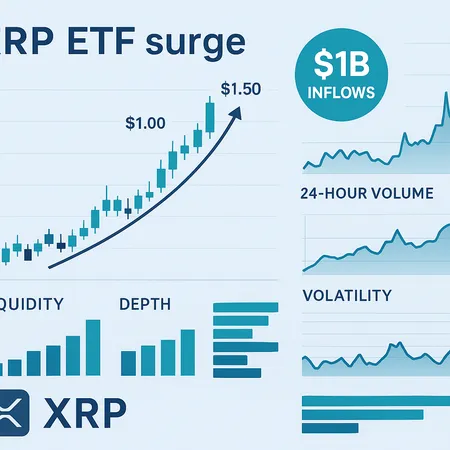
XRP ETFs have pulled in over $1 billion in under a month, reshaping how price discovery, liquidity and exchange dynamics function for the token. This article unpacks ETF mechanics, short‑term market signals, a bull‑case for multi‑dollar targets, key risks, and practical allocation guidance for speculators and institutions.
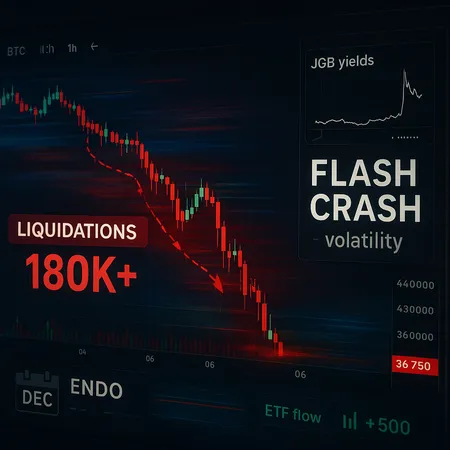
An investigative reconstruction of Bitcoin’s early-December flash crash, showing how a Japanese government bond yield shock met thin liquidity and algorithmic flows to spark a 180k+ trader liquidation cascade. Actionable risk-management and trade scenarios for traders and portfolio managers follow.

Recent institutional shifts — including a $114M net outflow from BlackRock’s Bitcoin ETF and IBIT’s bid to raise options limits — are reshaping liquidity, volatility, and hedging mechanics across BTC markets. This piece breaks down the mechanics, timeline, and practical implications for allocators and derivatives traders.
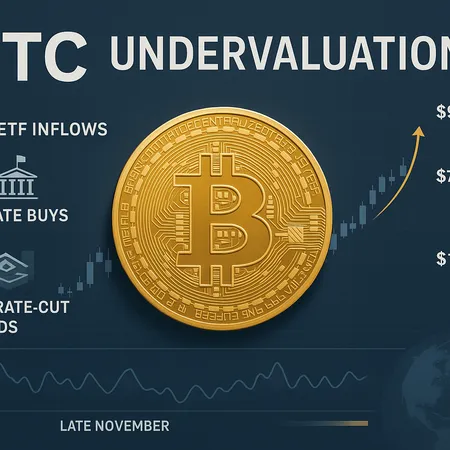
Bitcoin’s late‑November bounce has reignited debate — is this the start of a new sustained leg higher or a temporary relief rally? This article breaks down on‑chain and institutional signals, ETF/state buys, Fed‑rate dynamics, technical scenarios from $75k to $96k, and practical risk management for traders and allocators.

A tactical deep-dive into DOGE’s falling wedge, measured breakout targets toward $0.25, and the ETF-driven volatility mechanics that can create short-term spikes followed by mean reversion. Practical trade plans, sizing, and stop guidance for swing traders.
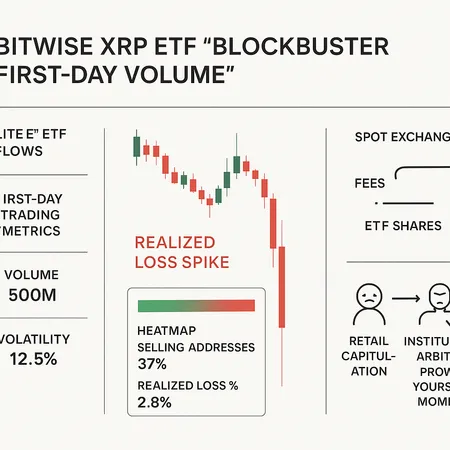
Bitwise’s XRP ETF posted a >$100M first‑day trading blaze while on‑chain metrics showed a wave of realized losses and retail capitulation. This explainer reconciles ETF flow mechanics, arbitrage paths, seller profiles, and practical risk management for active traders.
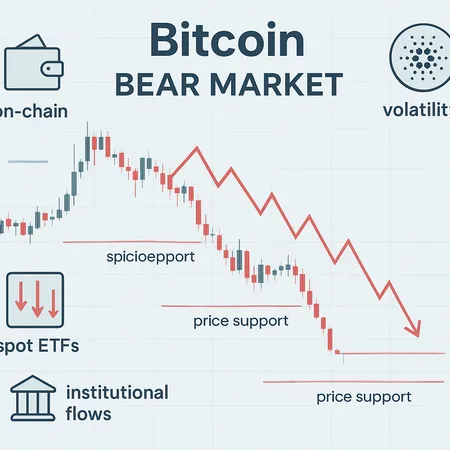
Recent headlines suggest Bitcoin has slipped into bearish territory, but ETF flows and short rebounds complicate the picture. This deep dive weighs on-chain signals, institutional flows, and vocal market forecasts to lay out practical positioning options for the next 3–12 months.
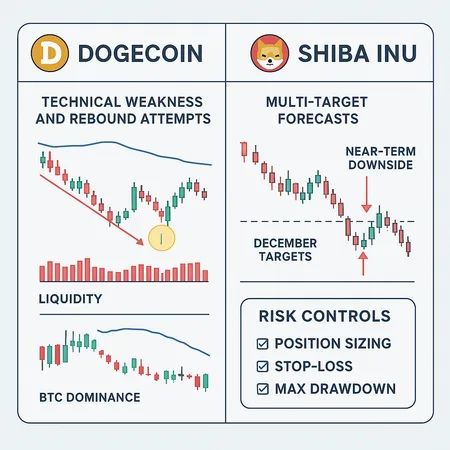
A tactical deep-dive into how Dogecoin’s technical frailty and Shiba Inu’s bifurcated forecasts play out during liquidity drains. Includes concrete entry/exit rules, position sizing formulas, and volatility controls for retail meme-coin traders.
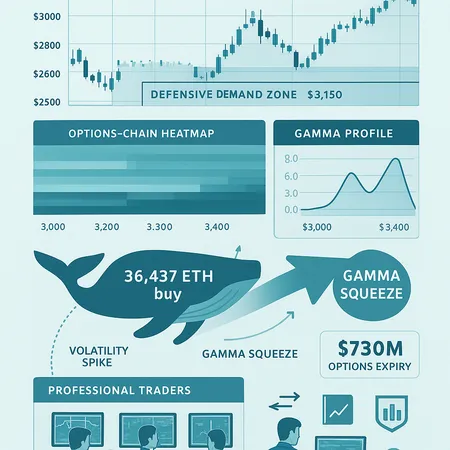
A $730M Ethereum options expiry and a large on‑chain accumulation (36,437 ETH) combined to create asymmetric risk around ETH, shifting short‑term gamma and offering specific plays for options and spot desks. This piece breaks down the mechanics, evidence, and a practical playbook for navigating the aftermath.
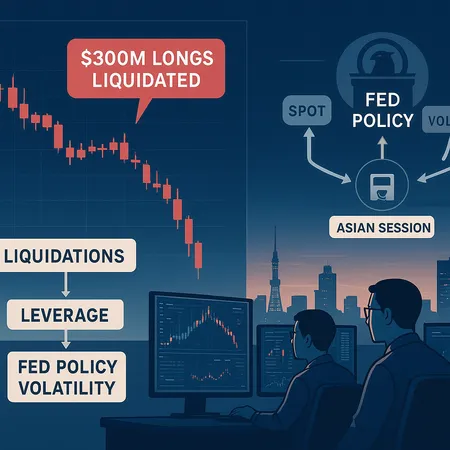
On Nov 14 Bitcoin plunged under $100,000 as roughly $300M of long positions were liquidated amid hawkish Fed comments — a classic cascade where derivatives, thin Asian liquidity, and macro re-pricing amplified each other. This deep-dive explains the mechanics, market-side effects, expected technical levels, and an operational risk-management playbook for traders and funds.