Bitcoin’s November Correction: STH Selling, Death Cross, ETF Flows and Macro Triggers
Summary
Executive summary
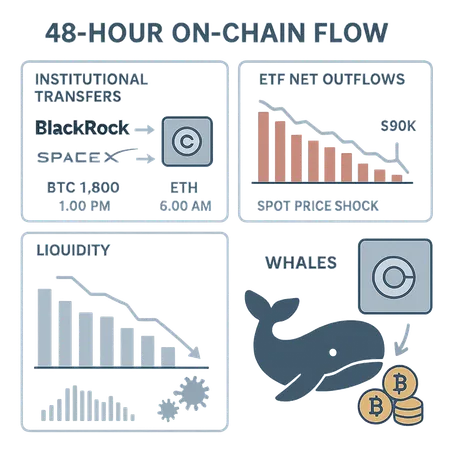
Bitcoin’s November correction was not one single event but the overlap of several risk vectors: short-term holder (STH) selling and exchange inflows on-chain, a deterioration of moving-average structure culminating in a death cross, episodic but powerful ETF flows, and a macro calendar that can flip liquidity expectations quickly. For intermediate traders and crypto PMs this matters because the intersection of on-chain and institutional liquidity dictates how fast risk unwinds and who absorbs it.
This article maps the evidence, lines up historical context for the death cross, shows how ETF flows have amplified volatility, and lays out practical signals and three trade-ready scenarios (bounce, consolidation, continued breakdown) with concrete risk-management strategies.
What the on-chain data is telling us: STH selling and exchange inflows
On-chain diagnostics are the first place to look when price moves sharply. In November, multiple metrics flagged selling pressure from short-term holders — wallets that bought recently and are now realizing losses or exiting positions. Analysis of STH behavior showed a discrete uptick in BTC moved by this cohort, consistent with a period of distribution rather than accumulation. For a direct breakdown of STH supply and realized-loss dynamics see the on-chain write-up documenting ~148k BTC of STH-related movement and a growing supply held at a loss.
At the same time, exchange balance metrics and large deposits spiked. When sizable BTC blocks hit exchanges it increases immediate liquidity available for market sellers and raises the probability of price slippage. Coinciding with those inflows were compressed funding rates and short-covering events — a classic sign that leveraged longs were being forced out while STHs and other sellers took profits or cut losses.
The death cross: what it is, why it matters and historical precedents
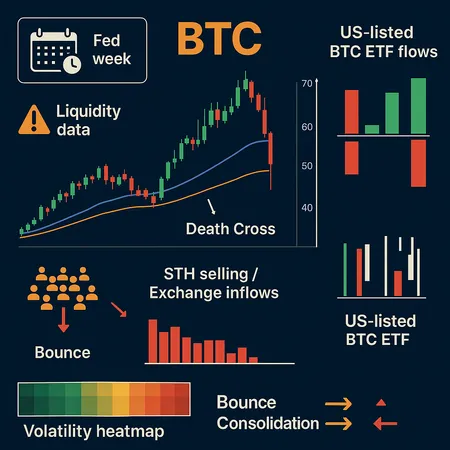
Technically, the death cross occurs when a shorter moving average (commonly the 50-day MA) crosses below a longer one (commonly the 200-day MA). It’s a momentum-style signal that markets use to mark structural weakness. Recently, BTC flashed this pattern and large transfers to exchanges followed, a combination that feeds into a liquidity-risk narrative: lower momentum plus higher available supply equals larger downside when buyers step back.
Important nuance: death crosses are lagging indicators. Historically they’ve often coincided with extended drawdowns but not always; there are precedents where the cross signaled a longer corrective phase and others where price found a base quickly because fundamental flows reversed (e.g., renewed ETF inflows or macro liquidity easing). A recent report documented the death cross in context of elevated exchange flows, strengthening the case that technical and liquidity risks were synchronizing rather than acting in isolation.
ETF flows: why US-listed ETFs amplify volatility
US-listed Bitcoin ETFs have added a new institutional plumbing layer to BTC price formation. They can provide steady bid during accumulation phases but can also accelerate moves when flows reverse. In November we saw the classic dynamic: net inflows had been providing a backstop for months, but as price weakened some institutional flows turned neutral or slightly negative, which removed a large structural buyer from the market.
ETF flows are large in dollar terms and arrive in discrete batches; when those batches pause or reverse, market depth matters. Coverage of ETF flows during the recent weakness shows meaningful inflows into ETFs even as price struggled, illustrating how flows can both support price and feed volatility when sentiment flips. Tracking daily ETF flows alongside exchange inflows gives a real-time read on whether the institutional bid remains intact or is withdrawing.
Macro and liquidity: the Fed week that could flip sentiment
Macro timing matters. The market entered a critical macro week with the Fed and other liquidity datapoints on the calendar. Central bank tone, rate-path guidance and liquidity measures (M2, repo, system reserves) can quickly change marginal demand for risk assets. Previews of next-week Fed scenarios showed how even a small pivot in language—toward tighter liquidity or more aggressive rate normalization—could deepen a Bitcoin drawdown by pushing dollar funding costs up and encouraging global deleveraging.
Put simply: when macro liquidity tightens, leveraged positions in crypto feel it first. Conversely, any sign of easing or a pause can trigger rapid short-covering and repricing higher. Tom Lee and other market commentators flagged market-maker distress and potential pivot points; those views matter because they suggest conditions where liquidity providers either step in or step back, amplifying the move.
Three clusters of signals to watch next (and how to monitor them)
On-chain liquidity: STH supply at a loss, exchange inflows, large block movements and realized-supply trends. Watch real-time exchange balances and STH net flows. If STH selling abates and exchange balances stop rising, the liquidation tail may be over.
Market structure: moving-average relationships, 50/200 cross confirmation, volume at price bands, derivatives open interest and funding. A confirmed death cross with rising open interest and persistent negative funding suggests a sellers’ market. Conversely, declining open interest with a price bounce reduces downside conviction.
Macro / ETF flows: daily ETF net flows, US monetary policy language, and system liquidity prints. Watch ETF flow trackers for sudden outflows and the Fed-week commentary for liquidity shifts — both can flip institutional appetite quickly. For ETF flow context see coverage tracking how US ETFs posted sizable net flows even as price struggled.
Monitoring these three clusters gives allocators a robust cross-check: on-chain tells you who is selling, market structure tells you how the market is behaving, and macro/ETF flows tell you whether larger institutional buyers will absorb stress.
Trade scenarios and decision rules
Below are three actionable scenarios with the signals that would validate each, and sample decision rules suited to intermediate traders and crypto PMs.
Scenario A — Bounce (mean-reversion)
What validates it: STH selling tapers, exchange balances plateau, ETF net inflows resume and price reclaims the short moving average with volume. Macro commentary is neutral-to-dovish.
Tactical approach: size entries in tranches, use tight protective hedges (short-dated puts or collars), set staggered add-on levels on volume-confirmed break above the 50-MA. Targets should be defined by prior high-volume nodes and realized volatility expectations. Keep leverage low; expect sharp swings even during a bounce.
Scenario B — Consolidation (range, volatility widens but no trend)
What validates it: Exchange inflows stabilize but STHs hold onto positions; ETF flows are flat; moving averages remain intertwined without a decisive directional cross. Macro data is mixed.
Tactical approach: trade the range — short-term options premium selling (short-dated spreads), cash-hedged directional exposures, and use mean-reversion size limits. For PMs, consider reducing net exposure and opportunistically harvesting volatility while maintaining a small directional tilt.
Scenario C — Continued breakdown (deepening sell-off)
What validates it: Renewed STH selling and fresh exchange deposits, death cross confirmed with accelerating open interest on the short side, ETF flows turn negative and macro liquidity tightens.
Tactical approach: cut size or outright hedge via put buys or futures shorting. If you want to play the downside, laddered shorts with defined stops are safer than a single large bet. Institutional PMs should review mandate limits and counterparty concentrations; use cross-asset hedges (e.g., hedging beta in a multi-asset book) and consider cash preservation.
Three practical risk-management strategies
Pre-define pain points and scale: set percentage-of-AUM exposure caps and predefine add-on tiers. Use laddered entries to avoid single-price exposure during high volatility.
Options-based protection and income layering: buy short-dated puts for tail protection and sell covered calls or spreads to reduce hedging cost. For PMs, collars can protect large positions while allowing limited upside capture.
Correlative and liquidity-focused hedges: when ETFs or macro liquidity are the risk drivers, hedge using correlated instruments (futures or ETFs) with close liquidity profiles rather than illiquid OTC swaps. Ensure counterparties and execution venues can handle spikes in demand — illiquid hedge execution can amplify losses.
Watchlist: concrete metrics and tools to follow daily
- STH supply change and supply held at a loss (on-chain dashboards).
- Exchange BTC balances and large-block deposits (24–72h windows).
- Daily US-listed ETF net flows and AUM changes.
- 50/200 moving averages and the relative slope; derivatives open interest and funding rates.
- Fed comments, rate projections, and system liquidity prints (reserve balances, repo activity).
Combine these with volume-by-price and realized vs implied volatility to build a probabilistic view rather than a binary one. Institutional allocators using platforms like Bitlet.app should map these data streams into portfolio-level stress tests so position sizing reflects liquidity risk, not just directional conviction.
Final thoughts — probabilities, not certainties
The November correction is an instructive case: price action arose from overlapping liquidity, behavioral and macro factors. No single signal — not even a death cross — is a guaranteed predictor. What matters for traders and PMs is the orchestration of signals: are on-chain sellers still unloading? Are ETFs still providing a structural bid? Is macro liquidity tightening? Answering those questions with disciplined sizing and explicit hedges is the most reliable path through elevated volatility.
If you want a quick follow-up, I can generate a daily watchlist template (with indicator thresholds and sample execution checks) you can plug into your trading desk workflow.